Down $20,000 / Technical Analysis

Clearly, we are seeing some volatility and drawdowns today and we may have to make some moves today. The obvious question is what happens next. The first thing I remind myself to do though is IGNORE THE NOISE! Good investors don’t make decisions based on what their portfolio did today.

As of writing this at 10:38 AM Eastern my personal accounts are down by over $20,000. That is about 4 times the value of my daily driver car! It is natural to have that stress me out a bit. But let me say it again, “good investors don’t make decisions based on what their portfolio did today.”

For the most part I think technical analysis alone doesn’t provide higher rates of return. This isn’t always true, but on average I believe technical analysis provides lower rates of return when you factor in costs, taxes, and missed opportunities.

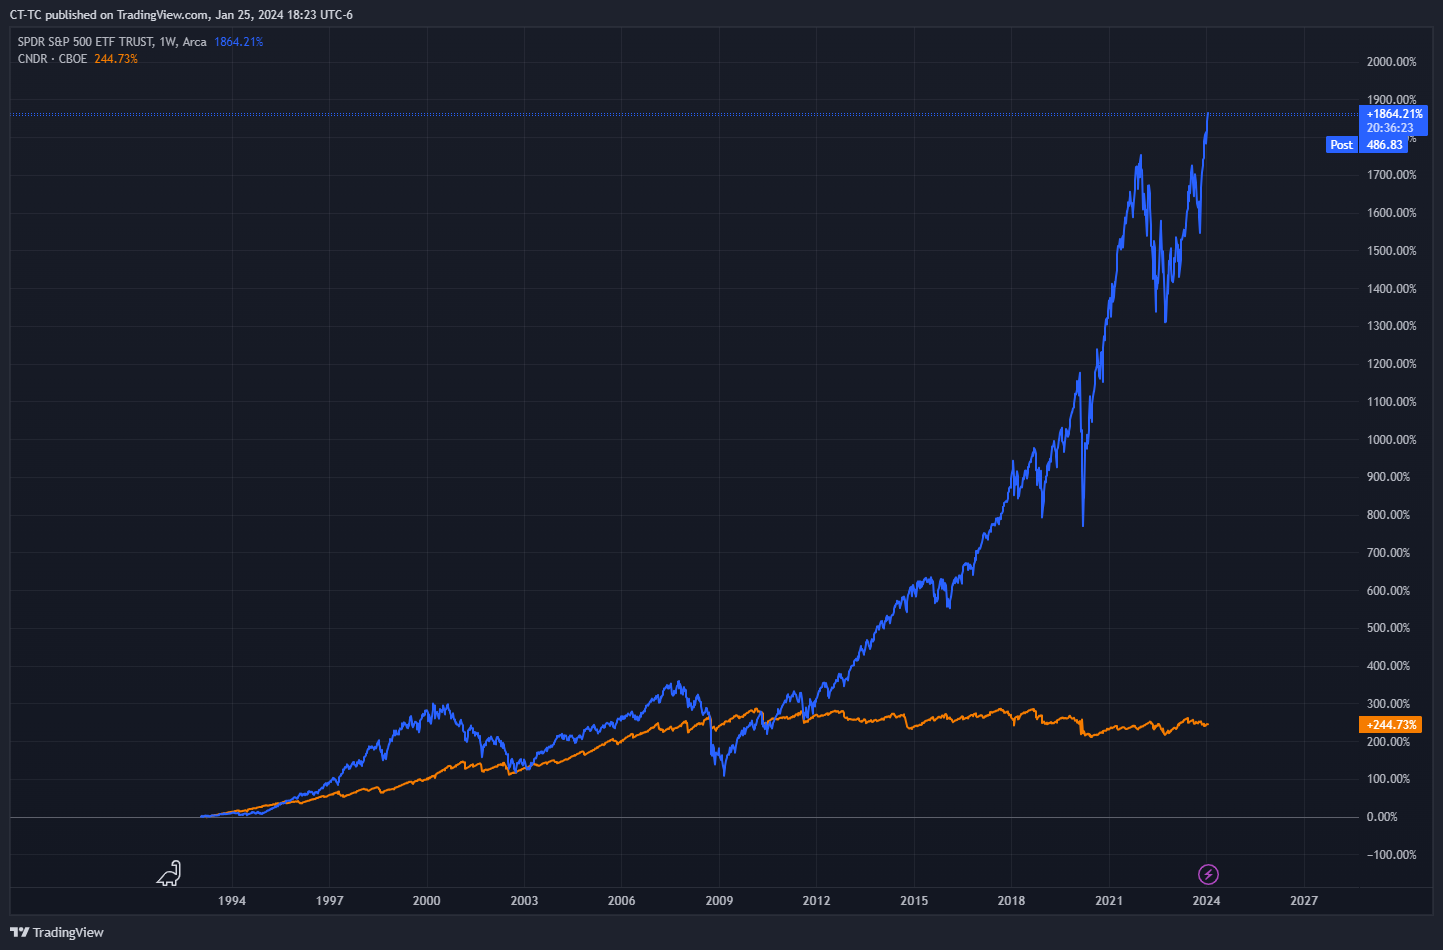
 Take for example the chart below. In red we can see TQQQ. In blue we can see a simple 200 day moving average model applied to TQQQ. Which one has a higher rate of return? The obvious benefit of the technical analysis system is that it has a better max drawdown. That is a big win. Likewise, a system like that could prevent an even larger drawdown that the buy and hold would likely experience in a period like the dot com bust.

Naturally some want to then trade more frequently. So, let’s look at a strategy where we follow the 50 day sma. In this we can see the drawdown is about the same, but the CAGR is much worse.

This pattern continues if we shorten the SMA to a 10-day sma.

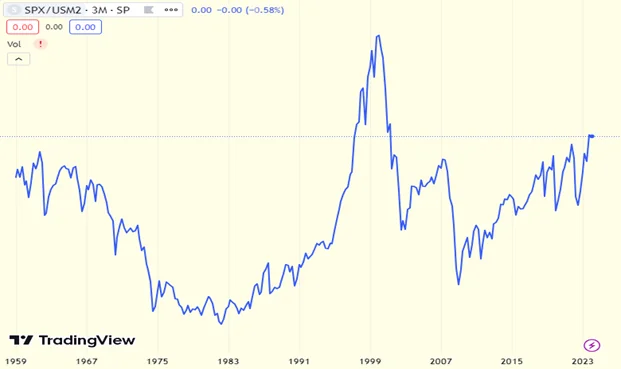
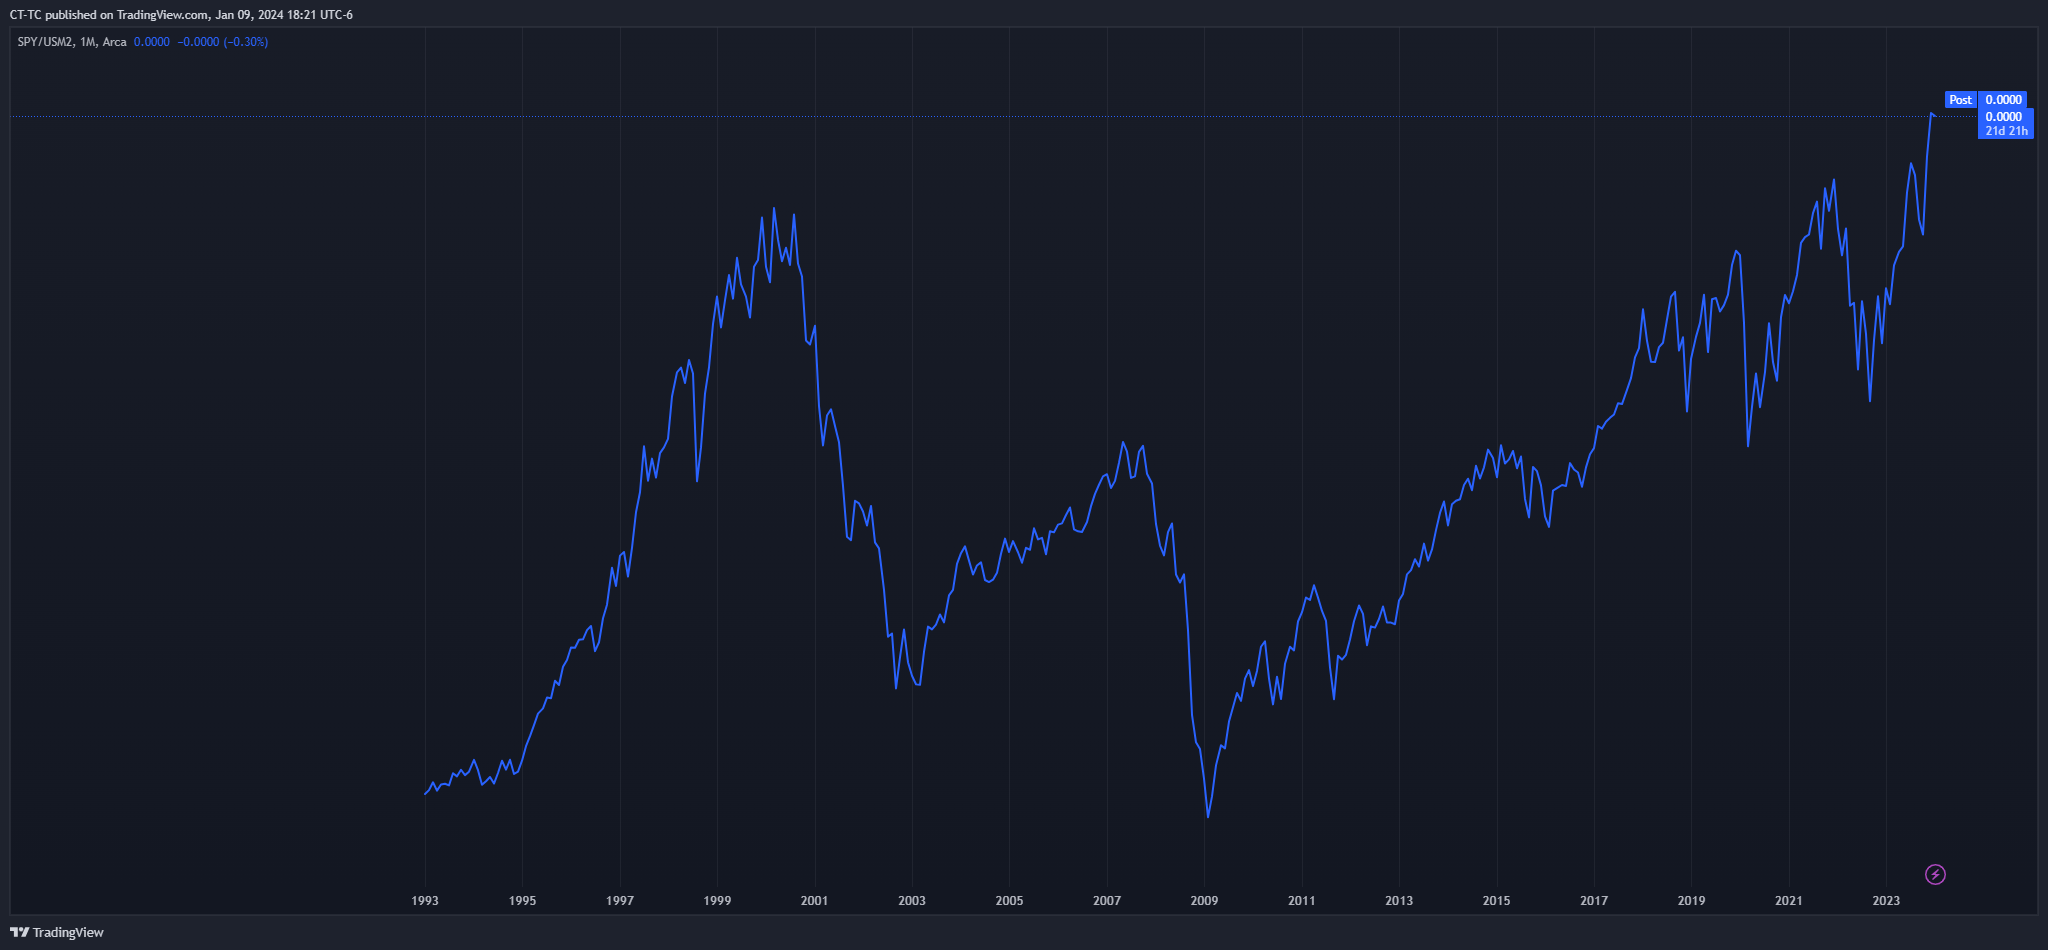
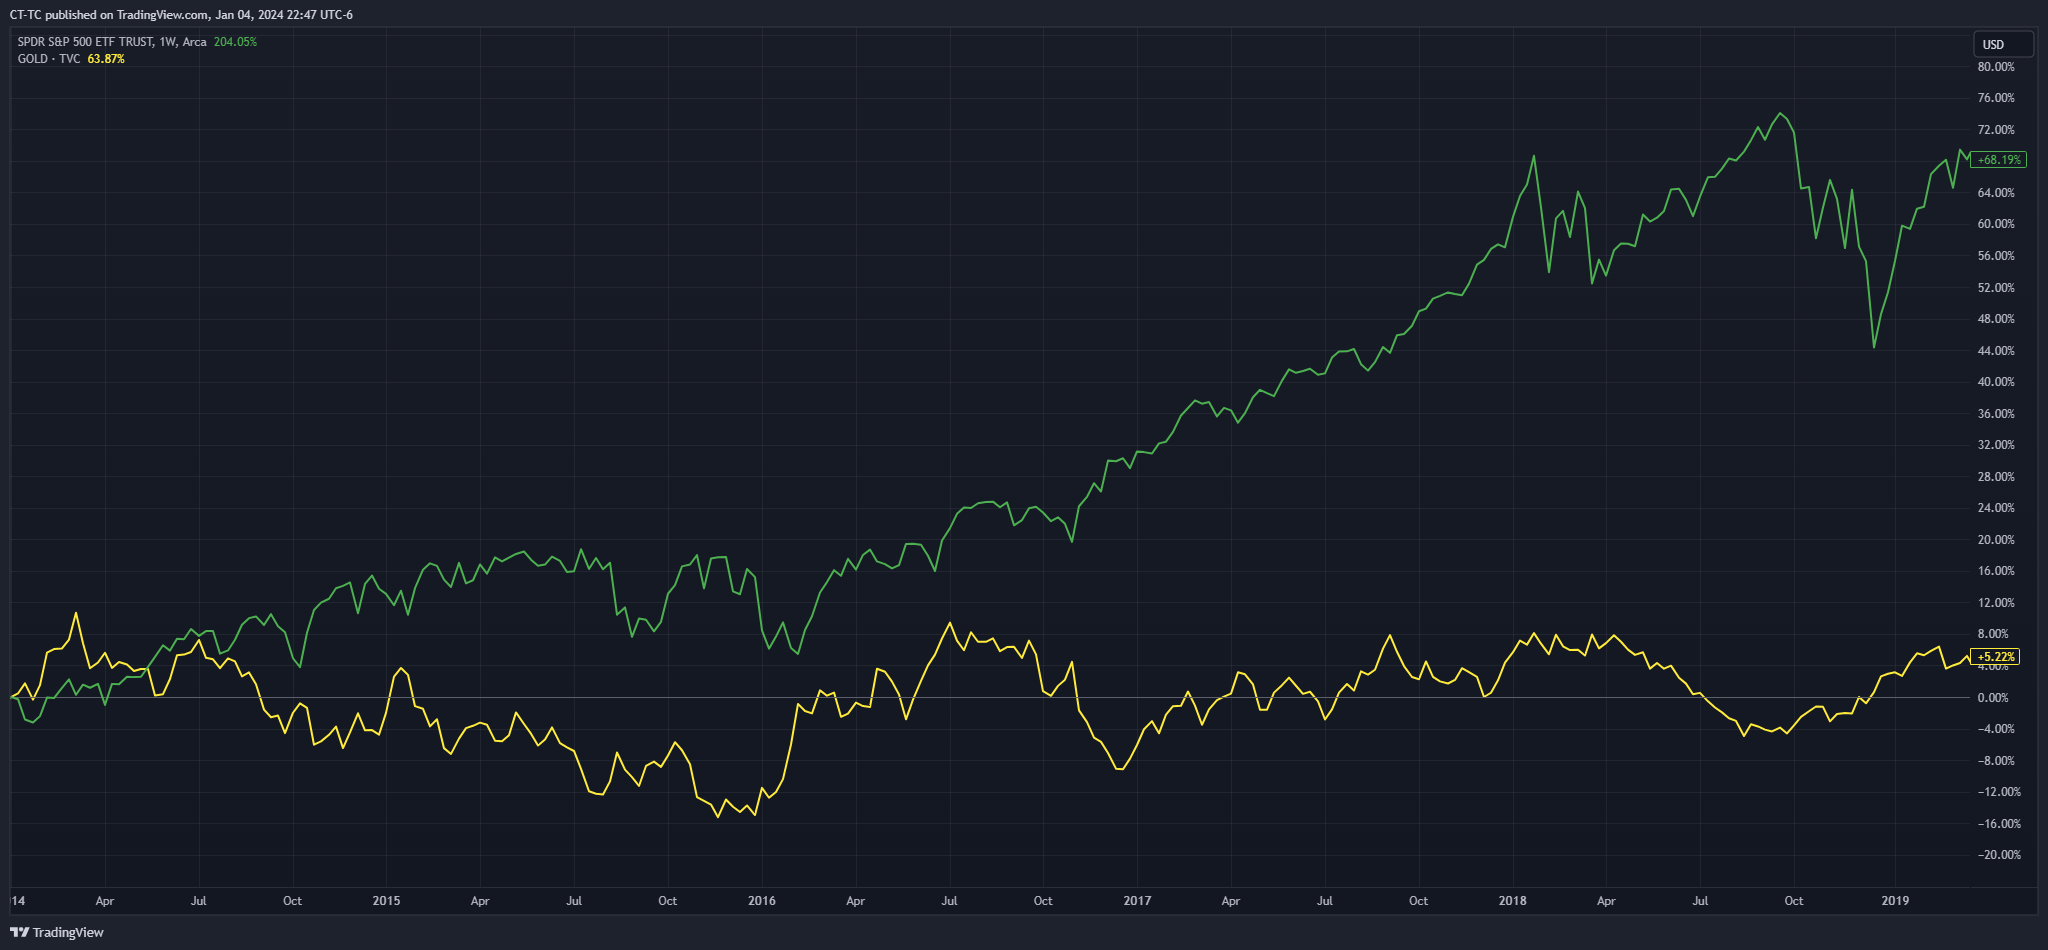
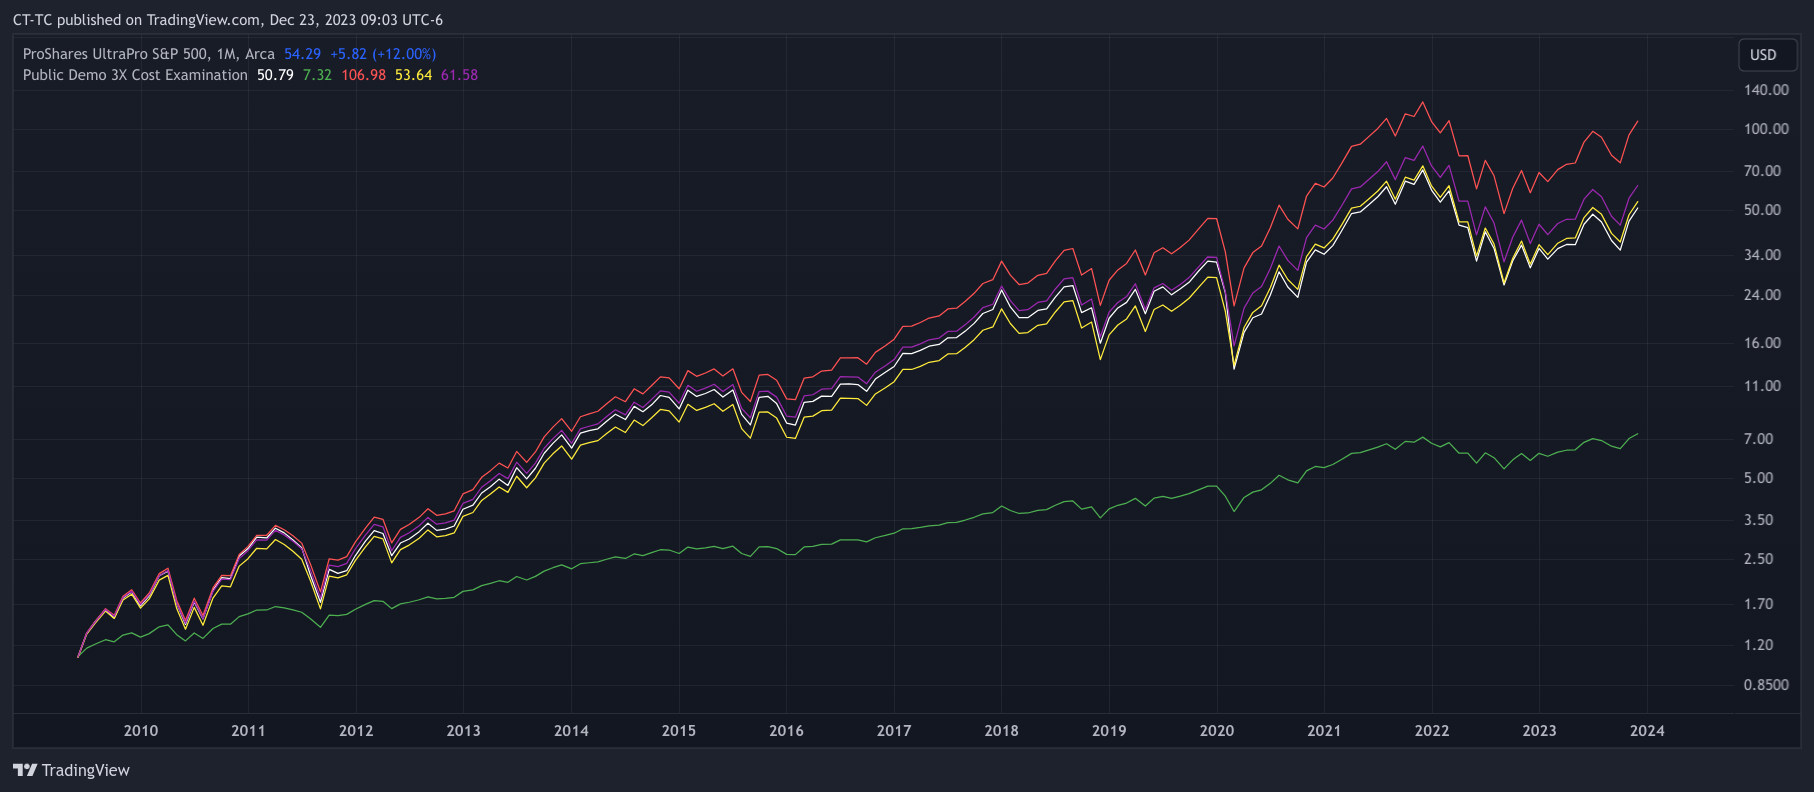
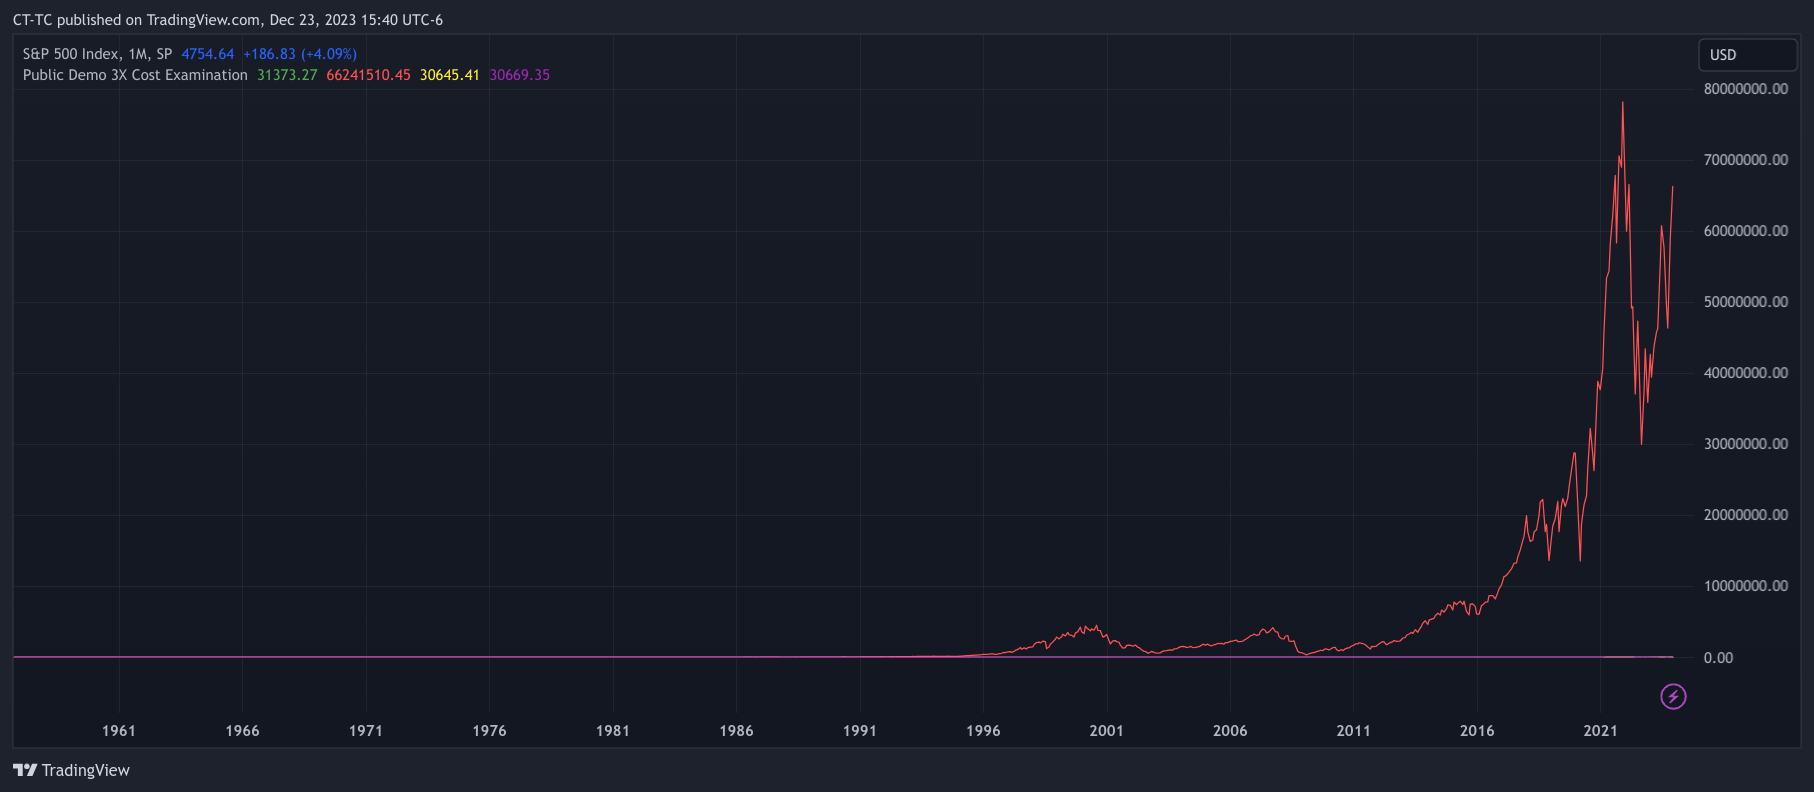
Now there are obviously ways to better utilize the 10-day sma and rotate into other assets etc. However, in general I believe there is this sweet spot. You don’t want to be a buy and hold investor with leverage, but you also don’t want to be a day trader with leverage. The downside of this sweet spot is that you will have days where you have sudden 5% drawdowns and on rare occasions larger than 10%. That just isn’t suitable for most people and that is okay. However, it is okay for me. Fortunately, I have been doing this long enough that I am able to roll with the punches. I didn’t really start trading this way until 2019, but once I did, I started to notice huge improvements. There is no covering up of the fact that 2022 was a rough year. But, in a longer-term context I think it makes sense. Take a look at this chart below of using 50/50 stocks and bonds with 3X leverage simulated going back to the 70s (source). This isn’t a perfect simulation as this free tool only allows flat leverage costs etc. However, it is a helpful demonstration. See how much money was made using leverage vs using the S&P 500. But look at the second chart below and tell me which year was the worst year for the leveraged portfolio. It was 2022. I mentioned this in 2022 and said it doesn’t mean 2023 is going to be bad. 2023 turned out to be great.

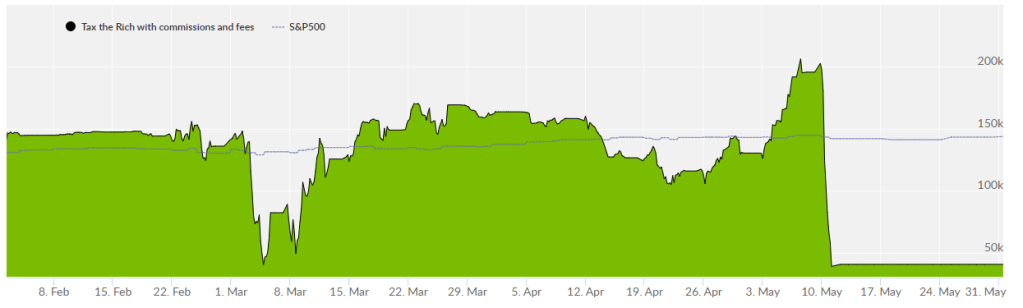
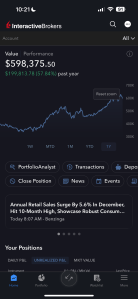
I have a host of signals I use in my algorithms. I don’t plan to share them all, but I will show my results. Below you can see a screenshot of my portfolio analyst report. In 2019, I started investing with my current approach and it has done wonders for me. I use this approach in my IRAs, HSAs, and taxable accounts. If you want to follow along you can use the blog or my links to my C2 strategies.

So I know on days like today people get jittery. I do too. We could be at the beginning of a 20% drawdown for my strategies. Or we could be about to experience a 20% launch. It is impossible to know. After the fed meeting today we may get some buy or sell signals. I do not know the future. Either way I will be sticking with my algorithms as I think they are my best chance to make money in the long run based on my extensive backtesting and live experience. I will not be taking trades because just because there has been a drawdown or because someone that hasn’t beat the S&P 500 thinks I should have tighter stops.

Disclaimer

This is not investment advice for you. This website is designed to talk about investments but it is not designed to give you personalized investment advice. This site contains generic information that does not have the capability of taking your personal risk tolerance, goals, assets, or other factors into account. Therefore, this site and all of its related content is for entertainment, informational, and educational purposes only.

The owner of PatienceToInvest.com is also a trade leader on Collective2.com. We may receive compensation by promoting some collective2 strategies over others. Should you decide to make or avoid any investments or use any service due to the information on this site or related information you assume full responsibility and risks and will not hold howiinvest.com it’s associated sites or its owners responsible. You also acknowledge investing is risky and can result in the loss of all your capital and even more than your original capital in some cases.

The Number 1 Strategy on Collective2

Whatever strategy is number 1 on Collective2 won’t stay that way. It never does. Let’s talk about why! The current number one strategy on Collective2 is about 16 months old. Not too long ago it popped into the number one spot. It currently has an annualized return of 133% and max drawdown of only 26.6%. That is awesome! Kudos to BlackBoulderTrading! But this strategy won’t stay number 1. Sorry.

Let’s take a look at some previous examples. Starting with my own.

Patience is a Virtue

Believe it or not my strategy Patience is a Virtue / How I Invest 1 OG was once upon a time the number one strategy. It had an annualized return of 189% in 2020 and a max drawdown of about 19%. It was doing amazing.

But fast forward from then to now and it hasn’t done nearly as well.

AI TQQQ SQQQ

Fortunately, I am not alone, this strategy by QuantTiger who seems to be a nice and reasonable person was also number one and for good reason. It had a return of about 274% with a max drawdown of less than 30%. Holy moly! Notice that is by far the best of the three discussed so far.

But carry forward from then to now it hasn’t done nearly as well.

Tax the Rich was #1

In early 2021 Tax the Rich was number one.

But fast forward from there and we see that it was a catastrophe going forward.

The Problems

  1. Past returns are not indicative of future returns. Investors need to stop writing this off as just some legal disclaimer. It is the cold hard truth! Beat it into your brain!
  2. No one is a fortune teller. Assuming no one is cheating, no one can predict fair coinflips over and over again at a rate better than 50%. They can’t! They may get it right the first time and start with a 100% success rate. They may even get the first 4 right and look like a genius. However, overtime their accuracy will continue to approach 50%. Likewise, If this year 100 new strategies start on collective2 using high levels of leverage and 100 different combinations of signals, assets, etc. at the end of two years by pure chance some of them are going to be crushing the market!
  3. Return Chasing: Investors underperform benchmarks because they return chase by buying whatever is recently popular and sell whatever has dropped in value recently. This leads to higher costs and often means buying high not low.

These are problems all investors face. The main difference between investors on C2 compared to a typical brokerage house is that C2 has higher risk strategies to pick from. So these problems get amplified. Those that are lucky have over 100% portfolio returns and those that are unlucky have 100% drawdowns etc. Sorry those of us that are lucky enough to get a 100% return year aren’t geniuses.

The Solution

I believe it is possible to do better than a typical stock mutual fund on C2 with a small tweak. Accept the following

  1. No one knows the future.
  2. No strategy is going to appear and double their investments every year for the next 8-10 years despite people saying “my hope is to get 1 double per year.”
  3. To have higher returns you must take on more risk, or get lucky.

I believe that using makes it possible to beat the market. Maybe instead of a 10% annualized with the S&P 500 a high risk investor with 3X leverage could get in the ballpark of 15% to 40% annualized for a decade. But this is very high risk! To mitigate some of the risk diversifying, reducing costs, good risk management, trend following, and other risk mitigation techniques may help make the drawdowns recoverable. Instead of a 90% drawdown from 3X leverage during 2008 maybe it is a only a 50% drawdown in 2022 because bonds and stocks dropped with rising interest rates etc. This is something I think is possible though far from guaranteed. However, getting 100% a year and not having a drawdown of 75% plus just isn’t going to happen over the course of decades. One of the two is going to break down.

How to Avoid Disaster C2

Furthermore I wouldn’t just pick any C2 Strategy. I would pick ones that fall within certain risk tolerance limits and that align with the philosophy I have just laid out. So the first thing I would check is whether or not the leader agrees that it is pretty much impossible to obtain higher rates of return without taking on higher levels of risk. They may talk about it in their description or their blogs, forums etc. (Like me!) Then I would make sure nothing fishy is going on and that the leaders are not taking on too much risk as shown in the images below. This can be the difference between a bad year and a negative 80% year!

MY Thoughts on the LeaderboardS

I also pretty much ignore the popularity leaderboard unless C2 changes the formula. I instead tend to mostly consider strategies in the category of stocks long-only/IRA friendly as this means you inherently have some risk measures in place. In fact, I did a forward test that lasted for almost 3 years where I rebalanced every so often into the top 15 strategies in different leaderboard categories. This table shows the results. As you can see the IRA board was the only one that beat the S&P500.

Unpopular opinion: the IRS is saving your booty by not letting you use 15X leverage with futures in your IRA.

In that screenshot you can see that I actually currently subscribe to Leveraged ETF Trading though I don’t AutoTrade it like I trade my own. I subscribed because it was cheap and I wanted to follow along live and get the email messages. However, I am still not comfortable enough to tie my own real money to the number 1 strategy.

You may also notice that my strategy How I Invest 2 IRA is currently the number 2 strategy on both the popularity and the IRA leaderboard. But as I have said it won’t stay there. It will have bad periods. This strategy How I Invest 2 is actually the same strategy as How I Invest 1 with mostly minor changes and just a different start date. But you can see that it is very popular right now because it is younger and only covers the period of recent good performance – which doesn’t tell you how well it will do next year! Below you can see an image of both strategies How I Invest 1 and 2 over the same time period. Notice how the NLV curves look the same if you zoom 1 into the same period that 2 existed.

I want to follow a trader that understands they can’t predict the future, they can’t beat massive trading institutions at their own game, previous drawdowns aren’t a good indicator of risk (particularly with short time periods on C2), and no 100% per year strategy is going to last on C2 as a 100% per year strategy. For myself I am that trader.

Market Inefficiencies Don’t Last

Sure I may be better at trading than Joe Shmoe, but for the most part that isn’t who you or I are competing against. We are competing against institutions that are massive and have huge resources in regards to money, people, technology etc. Likewise they are competing against each other too. If someone does find an inefficiency in the market they either take advantage of it until it is eroded, or the cat gets out of the bag and lots of people do it till it is eroded. Even people that are good run out of room to be good. Warren Buffett and Peter Lynch are great business analysist. But when you start to manage so much money that you are the market it becomes hard to beat it with any real significance. Had Peter Lynch stayed in the game long enough he likely would have had the same experience.

This quote from Sapiens touches on the point

“History cannot be explained deterministically and it cannot be predicted because it is chaotic. So many forces are at work and their interactions are so complex that extremely small variations in the strength of the forces and the way they interact produce huge differences in outcomes. Not only that, but history is what is called a ‘level two’ chaotic system. Chaotic systems come in two shapes. Level one chaos is chaos that does not react to predictions about it. The weather, for example, is a level one chaotic system. Though it is influenced by myriad factors, we can build computer models that take more and more of them into consideration, and produce better and better weather forecasts. Level two chaos is chaos that reacts to predictions about it, and therefore can never be predicted accurately. Markets, for example, are a level two chaotic system. What will happen if we develop a computer program that forecasts with 100 per cent accuracy the price of oil tomorrow? The price of oil will immediately react to the forecast, which would consequently fail to materialize. If the current price of oil is $90 a barrel, and the infallible computer program predicts that tomorrow it will be $100, traders will rush to buy oil so that they can profit from the predicted price rise. As a result, the price will shoot up to $100 a barrel today rather than tomorrow. Then what will happen tomorrow? Nobody knows.”

Yuval Noah Harari, Sapiens: A Brief History of Hum

I’m not saying there aren’t inefficiencies. I’m saying we don’t know what they are. There are a million and one ways that people try to make you think there is an obvious inefficiency they can exploit by selling puts, covered calls, iron condors, trend following, leverage, etc. These are just different way to package risk. Go look at the iron condor index (CNDR) or a covered call ETF versus the SPY or balanced fund. These are just different and often more expensive ways to package risk.

Follow What You Want

So by all means subscribe to whatever strategies you want on C2 and use whatever methodology you want. That is the beauty of C2. But IMHO you must accept the reality that it isn’t going to be a smooth ride, no matter how good someone’s performance has been. Likewise it is hard to distinguish between luck and skill. Accepting these tips may be the difference between actually benefitting from collective2 (as a subscriber) or just losing to the indexes like every other trader.

I have nothing against any of the strategies mentioned here. I realize this post may come off as though I think I know it all. I don’t! There are plenty of better investors than me, but I do think they would agree you can’t beat the market without taking on more risk – whether that comes from leverage, higher beta, or more concentration.

Disclaimer

This is not investment advice for you. This website is designed to talk about investments but it is not designed to give you personalized investment advice. This site contains generic information that does not have the capability of taking your personal risk tolerance, goals, assets, or other factors into account. Therefore, this site and all of its related content is for entertainment, informational, and educational purposes only.

The owner of PatienceToInvest.com is also a trade leader on Collective2.com. We may receive compensation by promoting some collective2 strategies over others. Should you decide to make or avoid any investments or use any service due to the information on this site or related information you assume full responsibility and risks and will not hold howiinvest.com it’s associated sites or its owners responsible. You also acknowledge investing is risky and can result in the loss of all your capital and even more than your original capital in some cases.

Strategy Updates Jan 17th, 2024

Days like today can be stressful. After hitting a high of $631,754 in my personal IBKR accounts six days ago, they are down to $595,848 in a string of three losing days. That is an average daily loss of $12,000 or 1.9% a day about three times worse than the market!

The desire to jump out can be high in moments like this. After all I have had such a good run since September when the accounts were at just $461,000 as shown in the image below. But it is important to ignore this impulse to trade based on recent return. It is better to only sell when the algorithms have a trigger.

This persistent myth and desire of high returns with low volatility does great damage to a our ability to obtain either. Over and over again it is shown that active traders, hedge funds, and professionals are not good at beating a simple index fund strategy. So why should I bother trading?

It is my view that to beat a market you must take on more risk than said market. If I want to beat the long-term total return of 0-3 month treasury bills the worst way is to go buy individual 0-3 month treasury bills. The best way statistically is to go invest my money in a higher risk asset assuming I am willing to accept higher volatility and remain invested longer.

In regards to the stock market one can do this by buying stocks with higher betas, purchasing options, using leverage via futures, leveraged etfs, margin loans, etc. These are all ways to take on more risk and have different pros and cons. One can try beating the market with stock picking but any success is likely due to luck or holding a higher average beta portfolio.

Generally I think technical analysis is unable to give you higher rates of return in the long run all else and in particular beta being equal. If you trade only SPY there is little chance that after taxes and fees you will be able to beat SPY total returns over a decade. However, if you trade UPRO (3X SPY) and use some risk mitigation techniques I think you can beat SPY in terms of total returns, but regardless of what your max draw down is you most certainly took more risk. Just because something worked out doesn’t mean you didn’t take more risk.

It is best to accept that it is impossible to predict what the next days market result will be. How ridiculous would I be if I thought I could predict the outcomes of a fair dice roll beyond the prophecies of statistics. How arrogant would I have to be to think I could predict the market better than the millions of professionals with billions of dollars under management.

This is why I believe it is best to mostly remain invested and just absorb the 3% down days etc. However, this doesn’t mean no trading should occur! There are two main reasons to make a trade.

  • Better Opportunity: If we are in stocks but according to the historical statistics bonds offer a better average daily return under x,y,z metrics then it is best to sell some stocks and buy some bonds.
  • Elevated Portfolio or Market Risk: Imagine you play a game where every correct coin flip you get a dollar and every wrong one you lose 50 cents. If your money hits zero you are done. If you start playing this game with $100 in reserve it is an easy money maker. If you start playing with only $1 it would be pretty easy to lose. Sometimes the risk can be too high because of market conditions. Sometimes the risk can be too high due to portfolio positions. Likewise if I were using $100 but the games metrics changed to earn $10 or lose $9 it may be best to take a pause.

My algorithms are getting closer and closer to having some sell signals for some of the portfolios, but I am not going to exit just because I had a 6% drawdown while using 3X ETFs. This is to be expected.

Disclaimer

This is not investment advice for you. This website is designed to talk about investments but it is not designed to give you personalized investment advice. This site contains generic information that does not have the capability of taking your personal risk tolerance, goals, assets, or other factors into account. Therefore, this site and all of its related content is for entertainment, informational, and educational purposes only.

The owner of PatienceToInvest.com is also a trade leader on Collective2.com. We may receive compensation by promoting some collective2 strategies over others. Should you decide to make or avoid any investments or use any service due to the information on this site or related information you assume full responsibility and risks and will not hold howiinvest.com it’s associated sites or its owners responsible. You also acknowledge investing is risky and can result in the loss of all your capital and even more than your original capital in some cases.

Gold Futures vs Options

I want to have some exposure to gold and silver even though I think their benefits are often oversold. I don’t hate gold or silver. The one asset I actually hate is non-interest earning cash (not to be confused with interest bearing cash). For example, I have several bank accounts that I want and need to keep, but they pay nearly zero interest. I have about $30K in cash that is just earning almost nothing even in a 5% interest environment.

I could move the funds but I like everything else about my banks. But to make myself feel better and as though that money is being invested I am on paper combining that cash with a small brokerage account and targeting investments at 1X leverage overall. So the brokerage account may on its own be at 10X leverage but the combination needs to be at 1X. I want to evaluate whether gold futures or options offer a better solution for a portion of this account.

Continue reading “Gold Futures vs Options”

Yet Another Incorrect Gold Bug

Not that Wall Street Bets is known for its accuracy but come one. This recent post get’s things totally wrong. No gold has not done nearly as well as stocks since 1972. It literally took me 2 minutes to fact check it. All I did was go to portfoliovisualizer.com then used the asset allocation which lets you go back to 1972. I plugged in one portfolio of US stocks and one portfolio of 100% gold. This link goes directly to the calculation page.

If you own rental houses you want the price of the property to go up, but you also care about collecting rent. With businesses you may collect profits at times without selling the business or you may reinvest the profits. Historically companies paid out more of their profits. More recently they tend to reinvest the profit. That is why today you may see only about 1.5% dividend on stocks, but in the 1980s you may have seen 5% as shown below.

The M2 money claim is also misleading. If you were to graph SPY/USM2 with and without dividends it the chart with dividends would be much better than SPX. Notice I am using SPY instead of SPX because you can’t directly factor in dividends with SPX on tradingview. The date range for SPX and SPY are not the same so you will have to just look at the first chart and match it with the time frame available for SPY.

To be clear going back in history the story is roughly the same if not even better for stocks. It is just a matter of how far back your data set goes.

If you want to see longer term comparisons check out my charts in this post.

The Original Chart

SPY/USM2 without Dividends

SPY/USM2 with dividends

Disclaimer

This is not investment advice for you. This website is designed to talk about investments but it is not designed to give you personalized investment advice. This site contains generic information that does not have the capability of taking your personal risk tolerance, goals, assets, or other factors into account. Therefore, this site and all of its related content is for entertainment, informational, and educational purposes only.

The owner of PatienceToInvest.com is also a trade leader on Collective2.com. We may receive compensation by promoting some collective2 strategies over others. Should you decide to make or avoid any investments or use any service due to the information on this site or related information you assume full responsibility and risks and will not hold howiinvest.com it’s associated sites or its owners responsible. You also acknowledge investing is risky and can result in the loss of all your capital and even more than your original capital in some cases.

Up $27,000 in one Day!

Screenshots, one day performance, one year performance – none of it matters! When I see posts like that I think of a casino advertisement showing jackpot winners. We know people win in a casino, but we also know that the odds of me walking into a casino and walking out with more money are not great.

With investing results it isn’t quite the same because unlike a casino the stock market is rigged in your favor. Monkeys can throw darts at a wall to pick stocks and make money overtime. It isn’t hard. The real question is are you getting results above and beyond pure luck or beyond other investment alternatives such as an index fund etc.

Yesterday my account really was up $27,000 as shown in the screenshot, but it was also down by $12,000 just the other day like I mentioned. Furthermore, you don’t know what my overall net worth is. Plus for all you know I’m just good at photoshop or it done on Fiverr. Yeah I am trying to get you attention with this screenshot, but I’m also telling you it is meaningless.

That is why I use a third party to verify my trading in several different accounts. You don’t have to just join some discord community and sift through all kinds of junk with people posting good testimonials and wonder if that was 1/100 people or really representative of the crowd. All you have to do is go to my strategies page and click the links to the third party verifier to see the results and follow the ongoing strategies. If you don’t have the time follow the trading you can even set up your brokerage account to copy me.

For the most part my strategies did not do much in terms of trading. I did rebalance some out of UPRO and into TQQQ. Other than that things have mostly stayed the same since yesterday.

Disclaimer

This is not investment advice for you. This website is designed to talk about investments but it is not designed to give you personalized investment advice. This site contains generic information that does not have the capability of taking your personal risk tolerance, goals, assets, or other factors into account. Therefore, this site and all of its related content is for entertainment, informational, and educational purposes only.

The owner of PatienceToInvest.com is also a trade leader on Collective2.com. We may receive compensation by promoting some collective2 strategies over others. Should you decide to make or avoid any investments or use any service due to the information on this site or related information you assume full responsibility and risks and will not hold howiinvest.com it’s associated sites or its owners responsible. You also acknowledge investing is risky and can result in the loss of all your capital and even more than your original capital in some cases.

Gambling with Bo Polny and Andy Schectman

I am not that into holding gold or silver permanently, per my previous post. However, sometimes when I get a stock tip or recommendation, I will buy a little of something even if I don’t expect it to do well. It can be a good motivator to follow along. Someone I know keeps sending me crazy predictions for gold and silver. In one of the predictions they sent the person claimed to be 99.9% sure that silver would go to $600 an ounce in 2024 (link to video timestamp). Now I am about 99.9% convinced that this guy is dead wrong. He was pretty wrong about his precious metal predictions that silver would go to $100 in 2017. But I thought it would be fun to follow along!

So today I decided to buy a little bit of gold and silver exposure via options. I didn’t want to tie up a lot of capital with this. So, I decided to use options. This allowed me to lay out about 1/10th the capital. The downside though is that if gold and silver don’t move up by about 10% then I am going to lose nearly all the money I put down. I need each of them to appreciate about 10% over the next year to break even. So, if this guy is right, which he isn’t, my little bet of about $1,600 on silver would become worth about $50,000! Too bad Bo Polny isn’t going to be right and the markets are not predictable based on time cycles or the Bible or prophecy. Instead of wasting a lot of money on the predictions he and Andy Schectman are making I will keep most of my money invested using my algorithms that have been doing great.

Disclaimer

This is not investment advice for you. This website is designed to talk about investments but it is not designed to give you personalized investment advice. This site contains generic information that does not have the capability of taking your personal risk tolerance, goals, assets, or other factors into account. Therefore, this site and all of its related content is for entertainment, informational, and educational purposes only.

The owner of PatienceToInvest.com is also a trade leader on Collective2.com. We may receive compensation by promoting some collective2 strategies over others. Should you decide to make or avoid any investments or use any service due to the information on this site or related information you assume full responsibility and risks and will not hold howiinvest.com it’s associated sites or its owners responsible. You also acknowledge investing is risky and can result in the loss of all your capital and even more than your original capital in some cases.

Gold and Silver, My View

Gold has been used as money and an investment for thousands of years. It is understandable that people like it, want to hold it, and expect it to increase in value. I expect gold to continue to increase in value in the future. However, I generally think people should taper their expectations of gold and silver. I think it is far from the best long term investment.

Pick the Best One

If you could only own one of the following which would you rather own?

  • All the gold and silver in the world.
  • All the real estate in the world.
  • All the companies in the world.

For me it is all the companies in the world. Real estate is number two. Gold and silver come in last for me because they are non-productive assets. Take a chunk of gold and put it in your desk. Come back 10 years later you will have the exact same amount of gold (assuming a secure desk). It will be worth more money most likely, but that is primarily because cash has become worth less and there are more people on earth. The gold bar did not grow in size or have little baby gold nuggets. It stayed how it is.

Instead imagine you put a few shares of some companies in your desk and walk away for ten years. When you come back you have those same shares. They too didn’t have little babies of paper, but what the shares represent may have grown. Had you put a share representing 1/10 of Apple in the year 2001 or 1/10th of Amazon you now still own just 1/10th of those companies, but those companies are way more valuable than they were 10 years prior. Now those companies own real estate, contracts, new intellectual property, manufacturing facilities, shipping facilities, they even own probably some gold and silver needed for their business operations and manufacturing. Businesses are productive assets. They can evolve into more in the future than they are today. Of course, many businesses fail. So it is best to diversify across many of them. Even when you take into account all the businesses fail the historical results for businesses are much better than gold.

Proof in the History

If we look at American businesses on average and compare them to gold over the last 100 years the picture is pretty clear for me.

$20 Invested in 1924 held until 2024
  • Gold went from $20.68 to $2046 – an annualized return of 4.7%
  • A market cap weighted investment in US stocks went from $20.68 to $412,000 – an annualized return of 10.4%.

My View of the History

For years gold was mostly flat until the early 70s. This is because the US had tied the dollar to gold. The price was set. When Nixon ended the gold standard we see a massive run up in the price of gold until about 1980. In my view this is because gold had been kept artificially low in this system. However, after the wild decade of the 70s it took about 30 years for gold to make a new all time high. Furthermore, if you adjust gold for inflation since 1980 it has barely made a new all time high.

Gold adjusted for inflation.

I think gold is a reasonable asset to hold in certain times particularly when there is extreme turmoil in markets or currencies. However, I think certain promoters of gold such as Peter Schiff, Bo Polny, Andy Schectman, Robert Kiyosaki, and the like tend to oversell golds and silver benefits and undersell the risks. Again, gold and silver may have a fantastic year this year or next year etc. At times I am a buyer of them. So if this year happens to be like the 70s that is great, I will start to buy it if the trend seems to be good enough for my metrics. I won’t just hold it forever personally, though I certainly think is is better than non-interest bearing cash.

History of Silver

As you can see below the performance of silver compared to stocks is somewhat similar.

Gold and Silver ETFs

Finally, I want to touch on the claims of some experts that you shouldn’t buy gold or silver ETFs since they are not real gold and silver. Many gold and silver ETFs do by law have to hold physical gold and silver in reserves. I think there are many benefits to this from ease of use, entry, exit, taxes, etc. It also makes you less of a target for robberies or other very real problems. If you do have a total breakdown of society where law and order are not to be found then yes you may have a case for holding physical gold and silver. However, at that point I think your best bet is to flee to another part of the world that is safer than where you are. Doing so with massive amounts of gold and silver on your person isn’t risk free.

Economic Crash

During many stock market crashes gold does fantastic. However, catching something like this is largely a matter of timing, which is notoriously hard to do. Take for example buying gold at the very beginning of 2008 then holding it for five years. It crushes the stock market.

It isn’t hard to imagine a person at the beginning of 2009 now saying, “dang I wish I would have bought gold!” So then they buy gold at the beginning of 2009 after the crash has happened. What happens though if you bought gold at the beginning of 2009 and hold for five years? You lose to the stock market. You miss out on about 80% of gains.

But then you decide to wait for the next crash because gold treated you well last time. So you hold for another five years from 2014 to 2019. Again you lose rather drastically to stocks.

This hypothetical example unfortunately is all too real for many investors whether they be into stocks, gold, silver, apple, amazon, meta, foreign stocks, domestic stocks, etc.

And for good measure here is gold vs us stocks for 2019 through 2023.

How I Use Gold and Silver

In the long term averages gold and silver simply haven’t performed as well as owning companies, and as mentioned I think this is because stocks represent companies which can evolve overtime unlike commodities. Commodities do experience fantastic moments. Oil futures at -$35, yes please. Gold after decades of a fixed price, yes please. Silver during a short-squeeze in the 80s – oh yeah baby! Unfortunately, most of the time on average commodities whether they be gold, silver, oil, wood, grain, are not productive assets. Often they cost money to store! They are fantastic in a pinch but the timing has to be right, which is notoriously hard.

Therefore, I primarily only hold gold, silver, and other commodities as a smaller diversifying portion of my assets, or I may allocate a higher portion. I only put them as a larger portion though if they are in an uptrend more so than other assets such as stocks, bonds, crypto, volatility products, etc.

As of writing this I have had a roughly 30% annualized return over the last 5 years. If I were to have held gold for the last 5 years as the majority of my portfolio that simply would not have been possible. I may come to eat my words in the future. Silver could have a huge short-squeeze or gold could become the most popular asset. If this does happen I hope to catch a decent portion of that move, but I know I won’t catch all of it. I’m okay with that.

To create these charts I used the SPX index from tradingview and the dividend yield of the S&P 500 from the tradingview source QUANDL:MULTPL/SP500_DIV_YIELD_MONTH.

Thanks for reading!

Disclaimer

This is not investment advice for you. This website is designed to talk about investments but it is not designed to give you personalized investment advice. This site contains generic information that does not have the capability of taking your personal risk tolerance, goals, assets, or other factors into account. Therefore, this site and all of its related content is for entertainment, informational, and educational purposes only.

The owner of PatienceToInvest.com is also a trade leader on Collective2.com. We may receive compensation by promoting some collective2 strategies over others. Should you decide to make or avoid any investments or use any service due to the information on this site or related information you assume full responsibility and risks and will not hold howiinvest.com it’s associated sites or its owners responsible. You also acknowledge investing is risky and can result in the loss of all your capital and even more than your original capital in some cases.

Bitconned (Great Documentary About Another Scam)

I just watched the documentary Bitconned on Netflix and loved it. However, I found myself screaming at the TV a bit in frustration. I couldn’t stand the main character and the people he surrounded himself with. I found them uncaring, manipulative, and deserving of lots of jail time.

The documentary does a great job showing the importance of real journalism and law enforcement – even if they were slow to act in the era of scam ICO offerings. I was rooting for the New York Times journalist the whole time.

Don’t get me wrong. I like cryptocurrency in many ways. But I will be the first to admit that the space is rife with scam artists. Much of this is because transactions are final and irreversible. So you have to be careful!

I remember in the 2017-2020 era seeing so many scams. Centra, the subject of the film was by no means the only scam. I spent hours trying to convince people that Bitconnect was a scam, usually to no avail. I remember talking to people and even one of the biggest YouTube promoters themselves in an effort to dissuade people. Of course I was met with statements like, “quite spreading fud!”

Check out the documentary trailer below.

I remember watching the actual Bitconnect event and the joy they all had because they all thought they were getting rich. To this day I didn’t know who was the leader of that scam, but I just looked it up. Apparently, a 36 year old from India was indicted last year as a part of the $2.4 billion cryptocurrency scheme. (source)

Disclaimer

This is not investment advice for you. This website is designed to talk about investments but it is not designed to give you personalized investment advice. This site contains generic information that does not have the capability of taking your personal risk tolerance, goals, assets, or other factors into account. Therefore, this site and all of its related content is for entertainment, informational, and educational purposes only.

The owner of PatienceToInvest.com is also a trade leader on Collective2.com. We may receive compensation by promoting some collective2 strategies over others. Should you decide to make or avoid any investments or use any service due to the information on this site or related information you assume full responsibility and risks and will not hold howiinvest.com it’s associated sites or its owners responsible. You also acknowledge investing is risky and can result in the loss of all your capital and even more than your original capital in some cases.

1955 & 1913 LETF Backtest

Leverage in markets is nothing new, but the forms and costs have certainly changed over time. In this post I wanted to model the importance of including borrowing costs in your analysis when deciding if leveraged ETFs (LETFs) are right for you.

In the next two charts you will see a log and a linear chart for the following:

  1. White: The total return of UPRO (an actual leveraged ETF).
  2. Green: The total return of the S&P 500 with dividends reinvested.
  3. Red: An estimate of a 3X leveraged ETF of the S&P 500 that only includes an expense ratio cost.
  4. Yellow: A 3X leveraged ETF that includes an expense ratio and estimates the cost of leverage using the 10 year treasury yield.
  5. Purple: A 3X leveraged ETF that includes an expense ratio and estimates the cost of leverage using the Fed Funds rate.
Log Scale 1. White is UPRO total return. 2. Green is SPXTR (S&P with dividends reinvested) 3. Red is 3X the monthly return of SPXTR with a 1% expense ratio 4. Yellow is 3X the monthly SPXTR return with leverage costs of 2 times the US 10 year yield and a 1% expense ratio. 5. Purple is 3X the monthly SPXTR return minus 2X (the Fed Funds Rate + 1%) minus 1% expense ratio.
Linear Scale. 1. White is UPRO total return. 2. Green is SPXTR (S&P with dividends reinvested) 3. Red is 3X the monthly return of SPXTR with a 1% expense ratio 4. Yellow is 3X the monthly SPXTR return with leverage costs of 2 times the US 10 year yield and a 1% expense ratio. 5. Purple is 3X the monthly SPXTR return minus 2X (the Fed Funds Rate + 1%) minus 1% expense ratio.

All three synthetic versions of UPRO may seem like reasonable estimates, but I don’t think this is the case. The red curve that does not include the cost of leverage is problematic. It overestimates the benefit of using leverage. In this timeframe when UPRO existed which is less than 15 years it is an okay estimate because the cost of leverage happened to be quite low at that time. However if we extend the backtests now to as far back as we have data on TradingView for the Fed Funds rate we will quickly see the problem.

Log Scale. 1. White or UPRO is no longer graphed as it is not available over this timeframe. 2. Green is SPXTR (S&P with dividends reinvested) 3. Red is 3X the monthly return of SPXTR with a 1% expense ratio 4. Yellow is 3X the monthly SPXTR return with leverage costs of 2 times the US 10 year yield and a 1% expense ratio. 5. Purple is 3X the monthly SPXTR return minus 2X (the Fed Funds Rate + 1%) minus 1% expense ratio.
Linear Scale. 1. White or UPRO is no longer graphed as it is not available over this timeframe. 2. Green is SPXTR (S&P with dividends reinvested) 3. Red is 3X the monthly return of SPXTR with a 1% expense ratio 4. Yellow is 3X the monthly SPXTR return with leverage costs of 2 times the US 10 year yield and a 1% expense ratio. 5. Purple is 3X the monthly SPXTR return minus 2X (the Fed Funds Rate + 1%) minus 1% expense ratio.

On the linear scale we can see that not graphing the cost of leverage leads to results that are dramatically unrealistic. If anyone is considering using leveraged ETFs they should be sure they understand the relationship between interest rates and the cost of leverage that they cause to the leveraged ETFs they use.

Going to 1913

The fed funds rate isn’t available prior to 1955 on tradingview but the 10 year US treasury yield is. Since we can see relativley similar results let’s now go back to 1913 with the synthetic version of a 3X leveraged ETF. I have intentionally used only monthly data up to now in order to allow going back to 1913. From 1913 to the 1950s only monthly data is available for SPX.

Log Scale. 1. White or UPRO is no longer graphed as it is not available over this timeframe. 2. Green is SPXTR (S&P with dividends reinvested) 3. Red is 3X the monthly return of SPXTR with a 1% expense ratio 4. Yellow is 3X the monthly SPXTR return with leverage costs of 2 times the US 10 year yield and a 1% expense ratio. 5. Purple is no longer available as the fedfunds rate data does not go back this far.

View, Track, and Copy My Trades Live

In addition to this blog you can follow a mixture of my live brokerage accounts and various strategies using the Strategies Page on my website. If you have the right brokerage account you can set it up to automatically copy my trading live. For more information check out the strategies page.

Resources

Below I have provided you with a link to the chart. You can zoom in our out and the chart should recalculate to what time frame you want to see. You can also use the excel file to see the data or you can take the code below and build on it.

https://www.tradingview.com/chart/oJyPPDp7/


//@version=5
//US SPX as security
//For each item the start period can only be about a year after that asset starts
//Stocks and Gold 1 Jan 1872
//Houseing
//https://www.tradingview.com/blog/en/pine-script-and-charts-become-better-acquainted-32927/

indicator(title="Demo History, Lev, Active", shorttitle="Public Demo 3X Cost Examination", overlay=true, timeframe="", timeframe_gaps=true)
StartTime = input.time(timestamp("1 May 1913"), title="Start Comparison Calc")
//StartTime = input.time(timestamp(chart.left_visible_bar_time), title="Start Comparison Calc")
//Price Function x days ago
priceXDaysAgo(numDays,PriceItem) =>
targetTimestamp = time - numDays*60*60*24*1000

// Declare a result variable with a "void" value
float result = if false
1

// We'll scan backwards through the preceding bars to find the first bar
// earlier than X days ago (it might be a little greater than X days if
// there was a break in trading: weekend, public holiday, etc.)
for i = 1 to 1000
if time[i] < targetTimestamp
result := PriceItem[i]
break
result
//
// Save the `open` of the leftmost visible bar.
var float chartOpen = na
if time == chart.left_visible_bar_time
chartOpen := open

//var leverageFee = input(Title= "Leverage Annual Cost %" ,2)
var chartStartTime = time
var SPXfilterTime = time


//Asset Data
UnderlyingClose = close
SPX_close = request.security('SPX', timeframe.period,close)
div = request.security('QUANDL:MULTPL/SP500_DIV_YIELD_MONTH',timeframe.period, close)
goldclose = request.security('TVC:GOLD',timeframe.period, close)
HouseClose = request.security('FRED:MSPUS',timeframe.period, close)
US10Yclose = request.security('TVC:US10Y',timeframe.period, close)
FEDFUNDSclose = request.security('FRED:FEDFUNDS',timeframe.period, close)

//Most Recent available data
float MostRecentDiv = 0
MostRecentDiv:=nz(div,nz(MostRecentDiv[1]))
float MostRecentSPX = 0
MostRecentSPX:=nz(SPX_close,nz(MostRecentSPX[1],4.5))
float MostRecentGold = 0
MostRecentGold:=nz(goldclose,nz(MostRecentGold[1],4.5))
float MostRecentHouse = 0
MostRecentHouse:=nz(HouseClose,nz(MostRecentHouse[1],4.5))
float MostRecent10Y = 0
MostRecent10Y:=nz(US10Yclose,nz(MostRecent10Y[1],4.5))
float MostRecentFEDFUNDS = 0
MostRecentFEDFUNDS:=nz(FEDFUNDSclose,nz(MostRecentFEDFUNDS[1],4.5))
float MostRecentUnderlying = 0
MostRecentUnderlying:=nz(UnderlyingClose,nz(MostRecentUnderlying[1],4.5))


//Period of dividend yield
time_between_bars = time_close-time_close[1]
days_between_bars = time_between_bars/24/60/60/1000
dailyDivYield = (math.pow(1+MostRecentDiv/100,1/365.25)-1)
PeriodDivYield = math.pow(1+dailyDivYield,days_between_bars)-1
//Need to find how to have SPXTR_PRICE on first bar be SPX bar. Then have it build from there.

//Growth Start
float UnderlyingGrowth = chartOpen
float SPXTR_Growth = chartOpen
float SPX_Growth = chartOpen
float Gold_Growth = chartOpen
float House_Growth = chartOpen
float B10Y_Growth = chartOpen
float MixGrowth = chartOpen
float LevMixGrowth = chartOpen
float ActLevMixGrowth = chartOpen
float levStocksGrowth = chartOpen
float levStocks10YGrowth = chartOpen
float levStocksFEDFundsGrowth = chartOpen
float ActiveMixNoLevGrowth=chartOpen
float levStocksGrowthwithborrow = chartOpen
float Active3XStocksGrowth = chartOpen
//Bond Price Calculation MostRecent10Y
MostRecentYield10Y = MostRecent10Y/100
Pv10Y = math.pow(1+MostRecentYield10Y,10)
YieldPeriod = MostRecentYield10Y/(365/days_between_bars)
float BondReturn = 0
float GoldReturn = 0
float SPXTRReturn = 0
float levstocksRETURN = 0
float levstocks10YRETURN = 0
float levstocksFEDFUNDSRETURN = 0


if time > StartTime
UnderlyingGrowth := (MostRecentUnderlying/nz(MostRecentUnderlying[1],MostRecentUnderlying))*nz(UnderlyingGrowth[1],UnderlyingGrowth)
SPX_Growth := (MostRecentSPX/nz(MostRecentSPX[1],MostRecentSPX))*nz(SPX_Growth[1],SPX_Growth)
SPXTR_Growth := (MostRecentSPX/nz(MostRecentSPX[1],MostRecentSPX)+nz(PeriodDivYield))*nz(SPXTR_Growth[1],SPXTR_Growth)
Gold_Growth := (MostRecentGold/nz(MostRecentGold[1],MostRecentGold))*nz(Gold_Growth[1],Gold_Growth)
House_Growth := (MostRecentHouse/nz(MostRecentHouse[1],MostRecentHouse))*nz(House_Growth[1],House_Growth)
B10Y_Growth := ((nz(Pv10Y[1],Pv10Y)-Pv10Y)/nz(Pv10Y[1],Pv10Y)+1+YieldPeriod)*nz(B10Y_Growth[1],B10Y_Growth)
BondReturn := B10Y_Growth/nz(B10Y_Growth[1],B10Y_Growth)-1
GoldReturn := Gold_Growth/nz(Gold_Growth[1],Gold_Growth)-1
SPXTRReturn := SPXTR_Growth/nz(SPXTR_Growth[1],SPXTR_Growth)-1

MixGrowth := nz(MixGrowth[1],MixGrowth)*(1+BondReturn/3 + GoldReturn/3 + SPXTRReturn/3)
LevMixGrowth := nz(LevMixGrowth[1],LevMixGrowth)*(1+BondReturn + GoldReturn + SPXTRReturn-US10Yclose*2/100/12) // it does have 3x leverage because each is at full


/////////
levstocksRETURN := levStocksGrowth/nz(levStocksGrowth[1],levStocksGrowth)-1
levStocksGrowth := nz(levStocksGrowth[1],levStocksGrowth)*(1 + SPXTRReturn*3.0-1.0/100/12)
levStocks10YGrowth := nz(levStocks10YGrowth[1],levStocks10YGrowth)*(1 + SPXTRReturn*3.0-US10Yclose*2.0/100/12-1.0/100.0/12.0)
levStocksFEDFundsGrowth := nz(levStocksFEDFundsGrowth[1],levStocksFEDFundsGrowth)*(1 + SPXTRReturn*3.0-(FEDFUNDSclose+1.00)*2.00/100.0/12.0-1.0/100.0/12.0)

plot(UnderlyingGrowth, title="Selected Asset", color=color.white)
plot(SPXTR_Growth, title="S&P with DRIP", color=color.green)
plot(levStocksGrowth, title="3X Stocks - Exp Ratio", color=color.red)
plot(levStocks10YGrowth, title="3X Stocks - EXp Ratio and 10Y x 2", color=color.yellow)
plot(levStocksFEDFundsGrowth, title="3X Stocks - (Exp Ratio & 2x(Fedfunds + 1%))", color=color.purple)

Disclaimer

This is not investment advice for you. This website is designed to talk about investments but it is not designed to give you personalized investment advice. This site contains generic information that does not have the capability of taking your personal risk tolerance, goals, assets, or other factors into account. Therefore, this site and all of its related content is for entertainment, informational, and educational purposes only.

The owner of PatienceToInvest.com is also a trade leader on Collective2.com. We may receive compensation by promoting some collective2 strategies over others. Should you decide to make or avoid any investments or use any service due to the information on this site or related information you assume full responsibility and risks and will not hold howiinvest.com it’s associated sites or its owners responsible. You also acknowledge investing is risky and can result in the loss of all your capital and even more than your original capital in some cases.