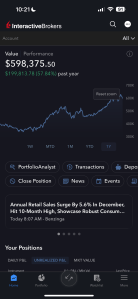
Days like today can be stressful. After hitting a high of $631,754 in my personal IBKR accounts six days ago, they are down to $595,848 in a string of three losing days. That is an average daily loss of $12,000 or 1.9% a day about three times worse than the market!
The desire to jump out can be high in moments like this. After all I have had such a good run since September when the accounts were at just $461,000 as shown in the image below. But it is important to ignore this impulse to trade based on recent return. It is better to only sell when the algorithms have a trigger.
This persistent myth and desire of high returns with low volatility does great damage to a our ability to obtain either. Over and over again it is shown that active traders, hedge funds, and professionals are not good at beating a simple index fund strategy. So why should I bother trading?
It is my view that to beat a market you must take on more risk than said market. If I want to beat the long-term total return of 0-3 month treasury bills the worst way is to go buy individual 0-3 month treasury bills. The best way statistically is to go invest my money in a higher risk asset assuming I am willing to accept higher volatility and remain invested longer.
In regards to the stock market one can do this by buying stocks with higher betas, purchasing options, using leverage via futures, leveraged etfs, margin loans, etc. These are all ways to take on more risk and have different pros and cons. One can try beating the market with stock picking but any success is likely due to luck or holding a higher average beta portfolio.
Generally I think technical analysis is unable to give you higher rates of return in the long run all else and in particular beta being equal. If you trade only SPY there is little chance that after taxes and fees you will be able to beat SPY total returns over a decade. However, if you trade UPRO (3X SPY) and use some risk mitigation techniques I think you can beat SPY in terms of total returns, but regardless of what your max draw down is you most certainly took more risk. Just because something worked out doesn’t mean you didn’t take more risk.
It is best to accept that it is impossible to predict what the next days market result will be. How ridiculous would I be if I thought I could predict the outcomes of a fair dice roll beyond the prophecies of statistics. How arrogant would I have to be to think I could predict the market better than the millions of professionals with billions of dollars under management.
This is why I believe it is best to mostly remain invested and just absorb the 3% down days etc. However, this doesn’t mean no trading should occur! There are two main reasons to make a trade.
Better Opportunity: If we are in stocks but according to the historical statistics bonds offer a better average daily return under x,y,z metrics then it is best to sell some stocks and buy some bonds.
Elevated Portfolio or Market Risk: Imagine you play a game where every correct coin flip you get a dollar and every wrong one you lose 50 cents. If your money hits zero you are done. If you start playing this game with $100 in reserve it is an easy money maker. If you start playing with only $1 it would be pretty easy to lose. Sometimes the risk can be too high because of market conditions. Sometimes the risk can be too high due to portfolio positions. Likewise if I were using $100 but the games metrics changed to earn $10 or lose $9 it may be best to take a pause.
My algorithms are getting closer and closer to having some sell signals for some of the portfolios, but I am not going to exit just because I had a 6% drawdown while using 3X ETFs. This is to be expected.
This is not investment advice for you. This website is designed to talk about investments but it is not designed to give you personalized investment advice. This site contains generic information that does not have the capability of taking your personal risk tolerance, goals, assets, or other factors into account. Therefore, this site and all of its related content is for entertainment, informational, and educational purposes only.
The owner of PatienceToInvest.com is also a trade leader on Collective2.com. We may receive compensation by promoting some collective2 strategies over others. Should you decide to make or avoid any investments or use any service due to the information on this site or related information you assume full responsibility and risks and will not hold howiinvest.com it’s associated sites or its owners responsible. You also acknowledge investing is risky and can result in the loss of all your capital and even more than your original capital in some cases.
I want to have some exposure to gold and silver even though I think their benefits are often oversold. I don’t hate gold or silver. The one asset I actually hate is non-interest earning cash (not to be confused with interest bearing cash). For example, I have several bank accounts that I want and need to keep, but they pay nearly zero interest. I have about $30K in cash that is just earning almost nothing even in a 5% interest environment.
I could move the funds but I like everything else about my banks. But to make myself feel better and as though that money is being invested I am on paper combining that cash with a small brokerage account and targeting investments at 1X leverage overall. So the brokerage account may on its own be at 10X leverage but the combination needs to be at 1X. I want to evaluate whether gold futures or options offer a better solution for a portion of this account.
Leverage in markets is nothing new, but the forms and costs have certainly changed over time. In this post I wanted to model the importance of including borrowing costs in your analysis when deciding if leveraged ETFs (LETFs) are right for you.
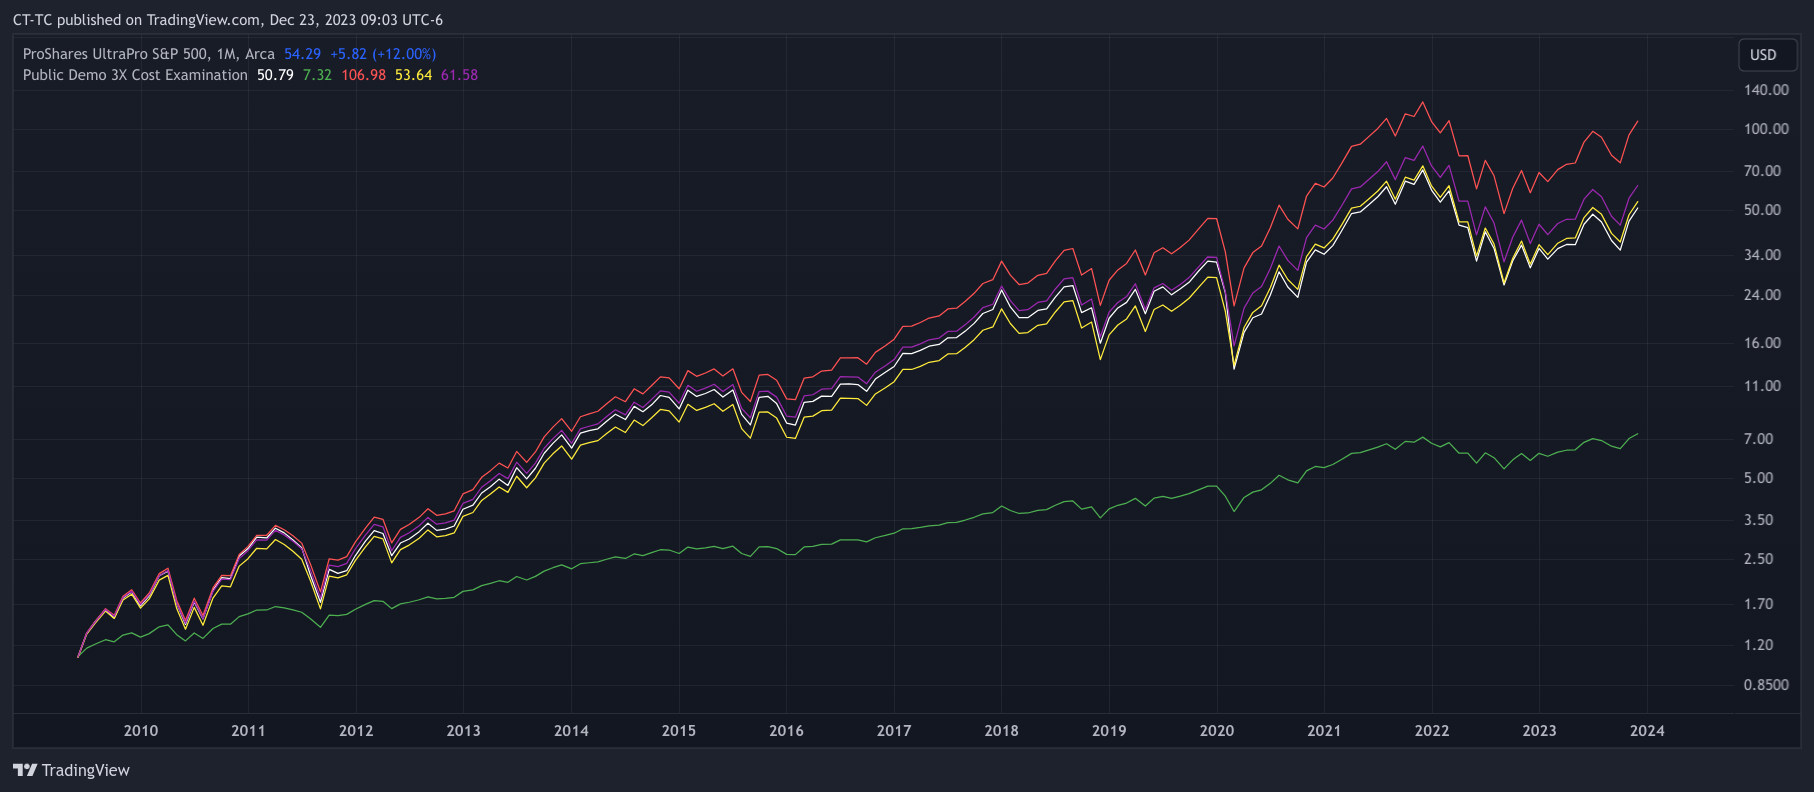
In the next two charts you will see a log and a linear chart for the following:
White: The total return of UPRO (an actual leveraged ETF).
Green: The total return of the S&P 500 with dividends reinvested.
Red: An estimate of a 3X leveraged ETF of the S&P 500 that only includes an expense ratio cost.
Yellow: A 3X leveraged ETF that includes an expense ratio and estimates the cost of leverage using the 10 year treasury yield.
Purple: A 3X leveraged ETF that includes an expense ratio and estimates the cost of leverage using the Fed Funds rate.
Log Scale 1. White is UPRO total return. 2. Green is SPXTR (S&P with dividends reinvested) 3. Red is 3X the monthly return of SPXTR with a 1% expense ratio 4. Yellow is 3X the monthly SPXTR return with leverage costs of 2 times the US 10 year yield and a 1% expense ratio. 5. Purple is 3X the monthly SPXTR return minus 2X (the Fed Funds Rate + 1%) minus 1% expense ratio. Linear Scale. 1. White is UPRO total return. 2. Green is SPXTR (S&P with dividends reinvested) 3. Red is 3X the monthly return of SPXTR with a 1% expense ratio 4. Yellow is 3X the monthly SPXTR return with leverage costs of 2 times the US 10 year yield and a 1% expense ratio. 5. Purple is 3X the monthly SPXTR return minus 2X (the Fed Funds Rate + 1%) minus 1% expense ratio.
All three synthetic versions of UPRO may seem like reasonable estimates, but I don’t think this is the case. The red curve that does not include the cost of leverage is problematic. It overestimates the benefit of using leverage. In this timeframe when UPRO existed which is less than 15 years it is an okay estimate because the cost of leverage happened to be quite low at that time. However if we extend the backtests now to as far back as we have data on TradingView for the Fed Funds rate we will quickly see the problem.
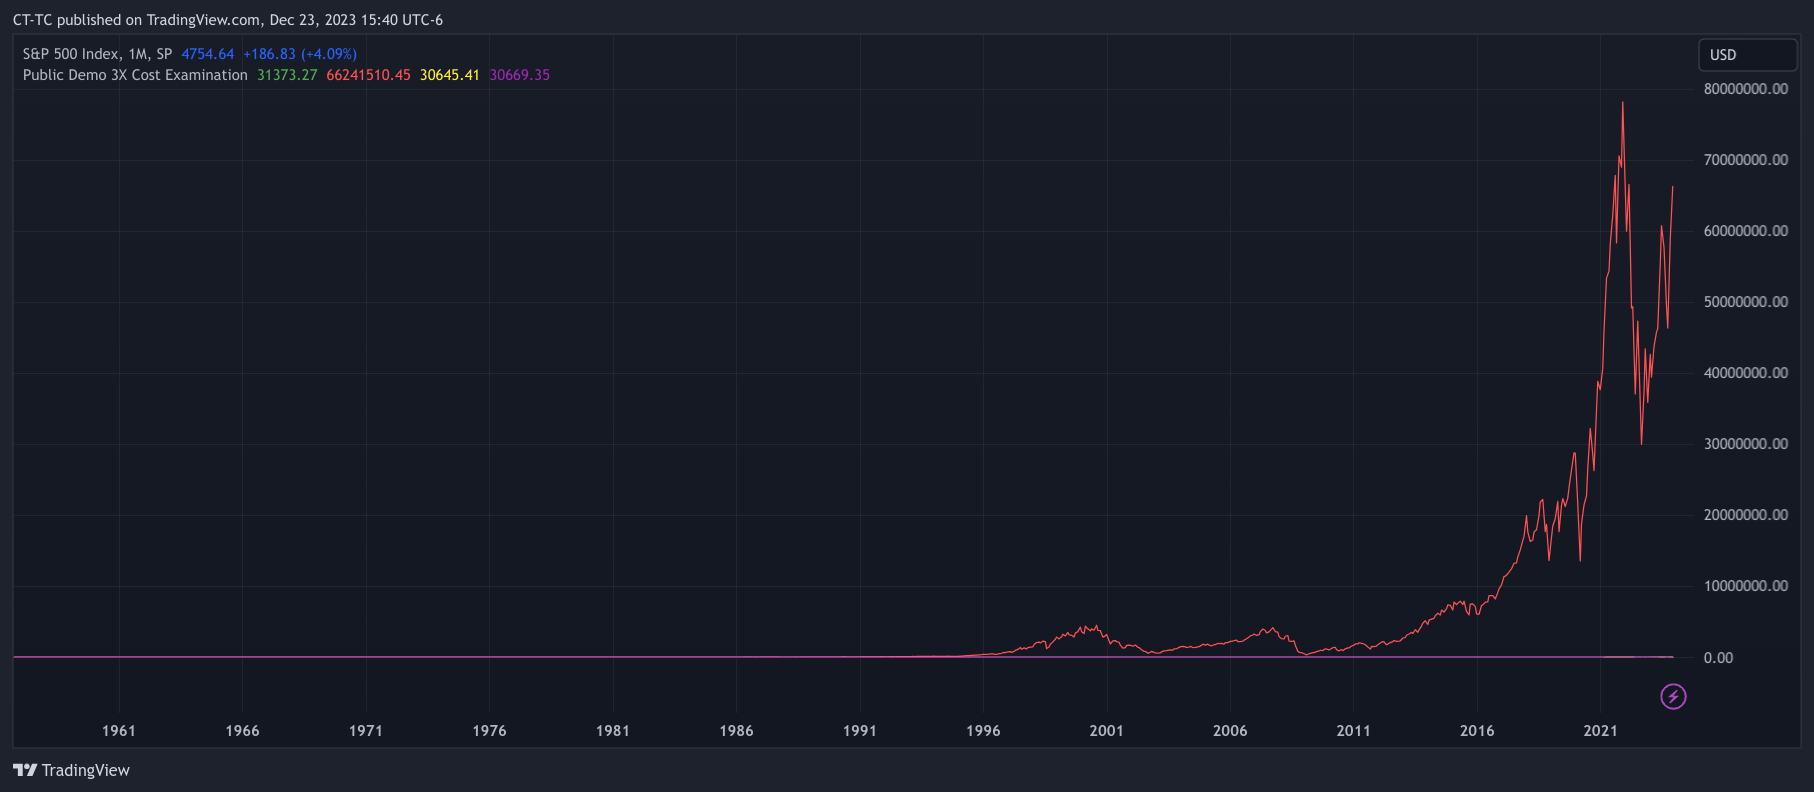
Log Scale. 1. White or UPRO is no longer graphed as it is not available over this timeframe. 2. Green is SPXTR (S&P with dividends reinvested) 3. Red is 3X the monthly return of SPXTR with a 1% expense ratio 4. Yellow is 3X the monthly SPXTR return with leverage costs of 2 times the US 10 year yield and a 1% expense ratio. 5. Purple is 3X the monthly SPXTR return minus 2X (the Fed Funds Rate + 1%) minus 1% expense ratio. Linear Scale. 1. White or UPRO is no longer graphed as it is not available over this timeframe. 2. Green is SPXTR (S&P with dividends reinvested) 3. Red is 3X the monthly return of SPXTR with a 1% expense ratio 4. Yellow is 3X the monthly SPXTR return with leverage costs of 2 times the US 10 year yield and a 1% expense ratio. 5. Purple is 3X the monthly SPXTR return minus 2X (the Fed Funds Rate + 1%) minus 1% expense ratio.
On the linear scale we can see that not graphing the cost of leverage leads to results that are dramatically unrealistic. If anyone is considering using leveraged ETFs they should be sure they understand the relationship between interest rates and the cost of leverage that they cause to the leveraged ETFs they use.
Going to 1913
The fed funds rate isn’t available prior to 1955 on tradingview but the 10 year US treasury yield is. Since we can see relativley similar results let’s now go back to 1913 with the synthetic version of a 3X leveraged ETF. I have intentionally used only monthly data up to now in order to allow going back to 1913. From 1913 to the 1950s only monthly data is available for SPX.
Log Scale. 1. White or UPRO is no longer graphed as it is not available over this timeframe. 2. Green is SPXTR (S&P with dividends reinvested) 3. Red is 3X the monthly return of SPXTR with a 1% expense ratio 4. Yellow is 3X the monthly SPXTR return with leverage costs of 2 times the US 10 year yield and a 1% expense ratio. 5. Purple is no longer available as the fedfunds rate data does not go back this far.
View, Track, and Copy My Trades Live
In addition to this blog you can follow a mixture of my live brokerage accounts and various strategies using the Strategies Page on my website. If you have the right brokerage account you can set it up to automatically copy my trading live. For more information check out the strategies page.
Resources
Below I have provided you with a link to the chart. You can zoom in our out and the chart should recalculate to what time frame you want to see. You can also use the excel file to see the data or you can take the code below and build on it.
//@version=5
//US SPX as security
//For each item the start period can only be about a year after that asset starts
//Stocks and Gold 1 Jan 1872
//Houseing
//https://www.tradingview.com/blog/en/pine-script-and-charts-become-better-acquainted-32927/
indicator(title="Demo History, Lev, Active", shorttitle="Public Demo 3X Cost Examination", overlay=true, timeframe="", timeframe_gaps=true)
StartTime = input.time(timestamp("1 May 1913"), title="Start Comparison Calc")
//StartTime = input.time(timestamp(chart.left_visible_bar_time), title="Start Comparison Calc")
//Price Function x days ago
priceXDaysAgo(numDays,PriceItem) =>
targetTimestamp = time - numDays*60*60*24*1000
// Declare a result variable with a "void" value
float result = if false
1
// We'll scan backwards through the preceding bars to find the first bar
// earlier than X days ago (it might be a little greater than X days if
// there was a break in trading: weekend, public holiday, etc.)
for i = 1 to 1000
if time[i] < targetTimestamp
result := PriceItem[i]
break
result
//
// Save the `open` of the leftmost visible bar.
var float chartOpen = na
if time == chart.left_visible_bar_time
chartOpen := open
//var leverageFee = input(Title= "Leverage Annual Cost %" ,2)
var chartStartTime = time
var SPXfilterTime = time
//Asset Data
UnderlyingClose = close
SPX_close = request.security('SPX', timeframe.period,close)
div = request.security('QUANDL:MULTPL/SP500_DIV_YIELD_MONTH',timeframe.period, close)
goldclose = request.security('TVC:GOLD',timeframe.period, close)
HouseClose = request.security('FRED:MSPUS',timeframe.period, close)
US10Yclose = request.security('TVC:US10Y',timeframe.period, close)
FEDFUNDSclose = request.security('FRED:FEDFUNDS',timeframe.period, close)
//Period of dividend yield
time_between_bars = time_close-time_close[1]
days_between_bars = time_between_bars/24/60/60/1000
dailyDivYield = (math.pow(1+MostRecentDiv/100,1/365.25)-1)
PeriodDivYield = math.pow(1+dailyDivYield,days_between_bars)-1
//Need to find how to have SPXTR_PRICE on first bar be SPX bar. Then have it build from there.
MixGrowth := nz(MixGrowth[1],MixGrowth)*(1+BondReturn/3 + GoldReturn/3 + SPXTRReturn/3)
LevMixGrowth := nz(LevMixGrowth[1],LevMixGrowth)*(1+BondReturn + GoldReturn + SPXTRReturn-US10Yclose*2/100/12) // it does have 3x leverage because each is at full
This is not investment advice for you. This website is designed to talk about investments but it is not designed to give you personalized investment advice. This site contains generic information that does not have the capability of taking your personal risk tolerance, goals, assets, or other factors into account. Therefore, this site and all of its related content is for entertainment, informational, and educational purposes only.
The owner of PatienceToInvest.com is also a trade leader on Collective2.com. We may receive compensation by promoting some collective2 strategies over others. Should you decide to make or avoid any investments or use any service due to the information on this site or related information you assume full responsibility and risks and will not hold howiinvest.com it’s associated sites or its owners responsible. You also acknowledge investing is risky and can result in the loss of all your capital and even more than your original capital in some cases.
Today my investments are down about $12,000. For months I have stayed mostly bullish because my algorithms have said to stay bullish. My intuition has frequently felt that it was a bad time to go long and my intuition is flaring up today. It may indeed be a bad time to be long the market and like a broken clock that is right twice a day my intuition may be right. But had I followed my intuition instead of my algorithms I likely would have been out of the market mostly starting at any or all of the red arrows shown below.
I think trading based on non objective analysis though is very hard and not something I am inclined to do. So when a day like today happens that is painful but my signals say to remain bullish I will remain bullish. This doesn’t mean that my systems couldn’t drop over the coming months then receive signals to exit, but generally I think I am way better off following my system rather than my intuition, gut, or non-objective chart analysis.
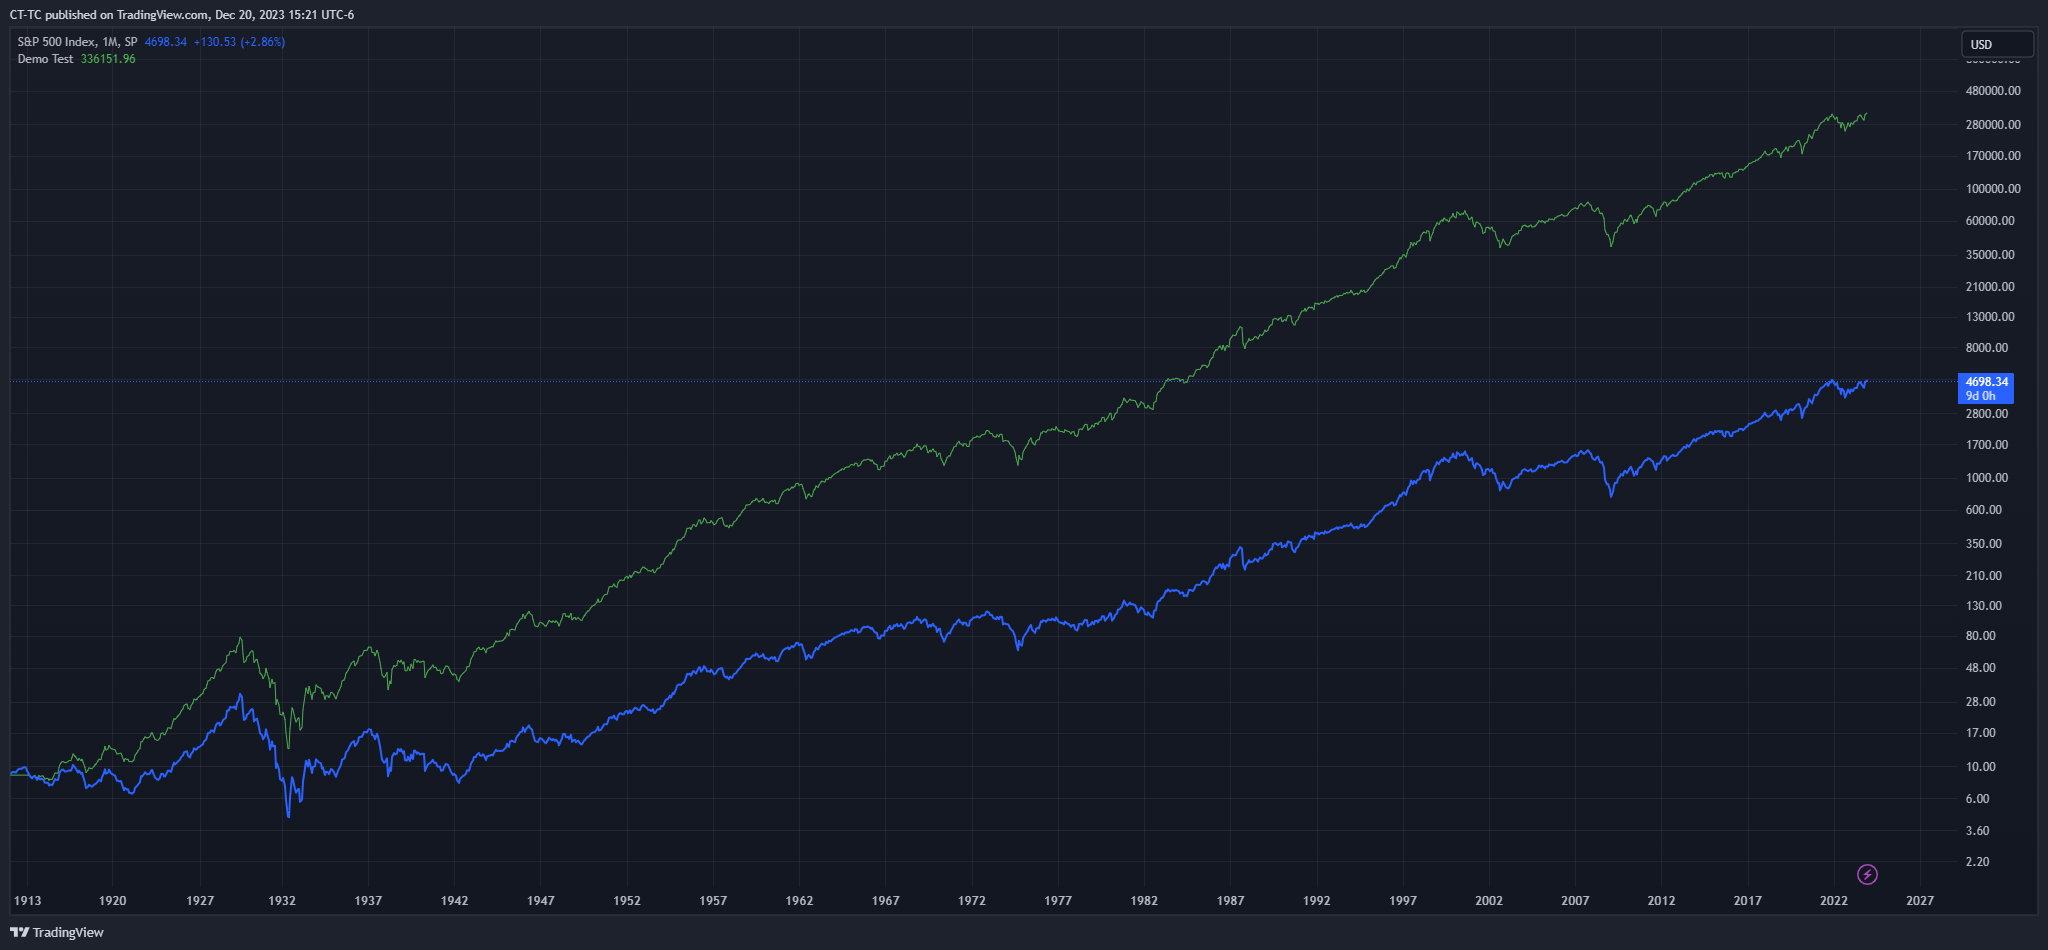
As always when in doubt it can help to zoom out on the larger picture. So if you don’t have a long track record yourself I would just say look at this chart of the S&P 500 with dividends reinvested to gain some perspective.
Green is SPX with Dividends Reinvested. Blue is SPX price appreciation only.
This is not investment advice for you. This website is designed to talk about investments but it is not designed to give you personalized investment advice. This site contains generic information that does not have the capability of taking your personal risk tolerance, goals, assets, or other factors into account. Therefore, this site and all of its related content is for entertainment, informational, and educational purposes only.
The owner of PatienceToInvest.com is also a trade leader on Collective2.com. We may receive compensation by promoting some collective2 strategies over others. Should you decide to make or avoid any investments or use any service due to the information on this site or related information you assume full responsibility and risks and will not hold howiinvest.com it’s associated sites or its owners responsible. You also acknowledge investing is risky and can result in the loss of all your capital and even more than your original capital in some cases.