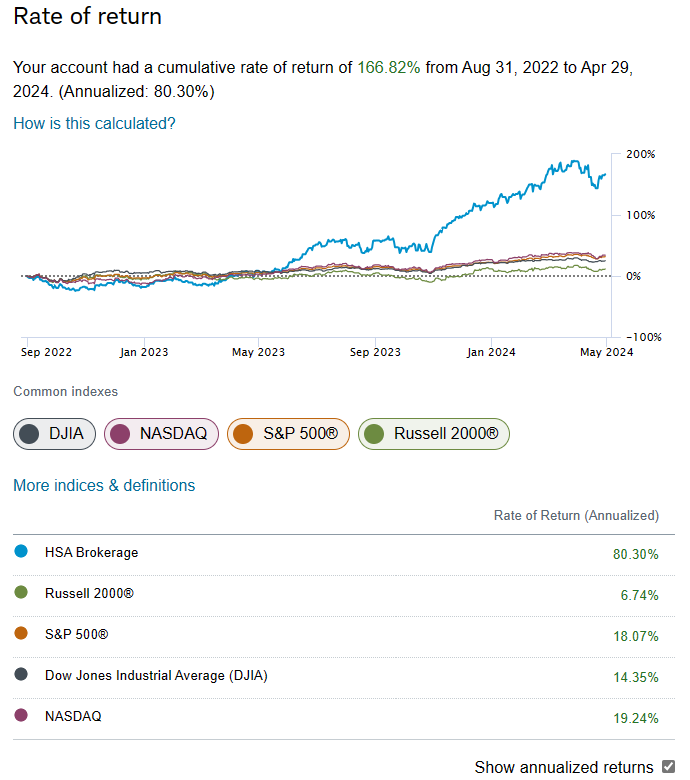
This collective2 strategy Easiest was started to copy what I do in my HSA (Health Savings Account) and track the results publicly. You can see the C2 and Schwab screenshots below. I am fortunate now to have plenty of money I can spend on upcoming medical bills.
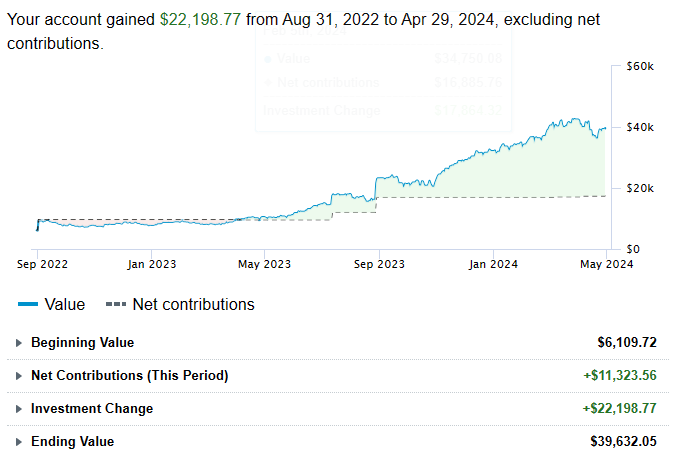
See the similarity with my HSA results from Schwab below.
There are some minor differences between the two partially due to laziness on my end of entering actual signals in my real account at Schwab, but the idea was the same. In a way, this strategy was always a Trades-Own-System strategy, but there was no way for Collective2 to verify that. Due to this, I have opened another Interactive Brokers Roth IRA to connect to Collective2 and set up my algorithms to automatically submit the orders to IBKR. However, I still have to manually these trades at Schwab since IBKR doesn’t have HSA accounts. Woe is me.
All that to say, soon you will see a TOS (Trades-Own-System) badge coming to Easiest. This also means that when I place a stop order at IB, you won’t see it as a subscriber until it gets triggered and will appear as a market order. The only downside I see is that you won’t see the stops. But you can always set your own stops as a secondary backup. I wouldn’t set them too close. Generally, I would keep them at about 10% for an unleveraged position and 30% for something with 3X leverage or similar. I know, I know. Those are huge, but if you want, you can use tighter stops. Price stops are not, in general, the main way I exit positions. My algorithms usually trigger before my stops are hit on any position. I know this may seem crazy, but think of it this way: If you and your neighbor bought homes at the same time for $500,000 each, but your neighbor a few months later suddenly sold for $250,000, would you want that to mean you automatically sell your house for $250,000? I wouldn’t! I always place stops, but my aim is to rarely, if ever, have them trigger.
This is not investment advice for you. This website is designed to talk about investments but it is not designed to give you personalized investment advice. This site contains generic information that does not have the capability of taking your personal risk tolerance, goals, assets, or other factors into account. Therefore, this site and all of its related content is for entertainment, informational, and educational purposes only.
The owner of PatienceToInvest.com is also a trade leader on Collective2.com. We may receive compensation by promoting some collective2 strategies over others. Should you decide to make or avoid any investments or use any service due to the information on this site or related information you assume full responsibility and risks and will not hold howiinvest.com it’s associated sites or its owners responsible. You also acknowledge investing is risky and can result in the loss of all your capital and even more than your original capital in some cases.
Focusing on methodology and investment philosophy is crucial when considering a strategy or a switch in investment. Recent performance, whether good or bad, doesn’t always reflect the long-term viability of a strategy. It is concerning when a provider claims something like they plan on consistent x% monthly return; such promises often fall short of reality in the complex world of trading.
My investment strategies, such as “Easiest” and “Patience is a Virtue,” embody a pragmatic understanding of the financial markets, grounded in the fundamental truth that in the world of investing, there are no guaranteed wins every year. Anyone promising otherwise is likely overselling or deluding themselves.
My approach acknowledges the inherent trade-off between risk and reward. Seeking higher returns inevitably involves embracing higher levels of risk. This requires the acceptance of higher drawdowns.
If you are still making the correct trades but experience drawdowns, they are not indicative of failure. Rather they are an inherent part of the investment journey. They are the price paid for the pursuit of potentially greater returns over the long term. While it’s possible to navigate and mitigate drawdowns to some extent, they cannot be entirely eliminated. They must be embraced and prepared for.
By adopting a mindset that embraces the reality of drawdowns, you’re better positioned to weather the storms of market volatility. Rather than being caught off guard or disillusioned by downturns, you’re prepared to stay the course, recognizing them as temporary setbacks within the broader context of your investment horizon.
In the pursuit of higher returns, it’s crucial to maintain a realistic perspective and remain committed to your investment philosophy, even in the face of temporary setbacks. This steadfast approach, grounded in the recognition of both the ups and downs of the market, lays the foundation for sustainable growth and long-term success.
Absolutely, believing in the investment thesis is paramount to successfully weathering drawdowns and staying committed to your strategy. Your thesis should reflect a comprehensive understanding of various asset classes and their potential for positive returns over the long term. An investment thesis should not involve the following:
XYZ went up last year/month/week. So I will buy it!
ABC went down last year/month/week. So I will sell it!
I believe there the next 20 years has great growth potential across equities, bonds, crypto, precious metals, and short volatility instruments. That is why I trade all these markets. This broad diversification allows me to capture opportunities across different sectors and asset types while managing risk through a well-rounded portfolio.
Taking it a step further down the risk rabbit hole, the best returns will likely be those that leverage their portfolios 2 or 3 times if they can remain solvent. This means using diversification, trend following, limited-loss leverage methods, and a healthy dose of patience.
Likewise, it will require rarely going against these markets. Frequently betting against the markets makes it so much harder to succeed in the long run. Your investment decisions should be rooted in a rational assessment of market dynamics, maximizing your chances of success over the long haul. Investment choices should never be made based on what went up last year and what went down.
This is not investment advice for you. This website is designed to talk about investments but it is not designed to give you personalized investment advice. This site contains generic information that does not have the capability of taking your personal risk tolerance, goals, assets, or other factors into account. Therefore, this site and all of its related content is for entertainment, informational, and educational purposes only.
The owner of PatienceToInvest.com is also a trade leader on Collective2.com. We may receive compensation by promoting some collective2 strategies over others. Should you decide to make or avoid any investments or use any service due to the information on this site or related information you assume full responsibility and risks and will not hold howiinvest.com it’s associated sites or its owners responsible. You also acknowledge investing is risky and can result in the loss of all your capital and even more than your original capital in some cases.
In the world of investment, especially in today’s dynamic markets, staying true to a long-term strategy can sometimes feel like navigating through a storm. One such day recently highlighted the challenges and the importance of staying focused on a larger plan despite short-term setbacks.
Yesterday started with a mix of holdings – 3X stocks, Bitcoin, a flat position in the volatility market, and a slightly bullish stance in the treasury market. However, as the day progressed, signals emerged, prompting a shift in strategy. The algorithm implemented the trades for Best Combo, Patience is a Virtue, and Easiest strategies, selling some Bitcoin, going short in the volatility market, exiting treasuries, and jumping into gold.
Fast forward to today, and unfortunately, it turned out to be mostly bad moves except for jumping into gold. The strategies, which typically combine elements of Best Combo, Patience is a Virtue, and Easiest, faced significant downturns today. The spike in volatility was particularly challenging, leading to losses across our positions.
Despite today’s losses, it’s crucial to note that none of the moves made yesterday were inherently wrong. Statistically, based on trusted indicators, the decisions were sound. However, as any seasoned investor knows, the market doesn’t always follow statistical probabilities in the short term.
The analogy of a casino comes to mind – even when the odds are in the casino’s favor, there are times when big payouts occur, causing temporary pain for the owners. In these moments, it’s essential not to dwell on a single trade, day, or month. Instead, maintaining focus on the broader plan spanning years is key.
Switching back and forth between positions can seem difficult right after some misses. But I believe sticking to a strategy is crucial to long-term success. Today’s losses may be tomorrow’s gains, and knee-jerk reactions can lead to missed opportunities in the long run.
Looking ahead, the plan remains steadfast. Implementing the Best Combo, Patience is a Virtue, and Easiest strategies might seem challenging during volatile times, but what matters is the statistical methodology guiding decisions for the next 5, 10, or 20 years. Short-term fluctuations are part of the journey, and staying disciplined through them is what separates successful long-term investors from the rest.
I say this as someone who is down $30,000 today personally. I know the pain. But I understand the goal and the method.
But I am also someone that has been following these basic investing methods since 2019 and it has paid off for me even with covid and 2022. Below you can see the results of my combined IBKR accounts.
The Eclipse
I did travel last week to see the total eclipse. I saw the total in 2017 and it clicked for me just how lame a partial eclipse is in comparison to a total. My phone didn’t do a great job capturing it. In person I really think a total eclipse is one of the most beautiful things to observe. I had a great time in Russellville, Arkansas with my wife and mom. Finally I think my mom is a total or nothing believer. I was a bit worried about the clouds for a bit but fortunately it was clear enough to see the total solar eclipse and two planets were bright enough to see too!
This is not investment advice for you. This website is designed to talk about investments but it is not designed to give you personalized investment advice. This site contains generic information that does not have the capability of taking your personal risk tolerance, goals, assets, or other factors into account. Therefore, this site and all of its related content is for entertainment, informational, and educational purposes only.
The owner of PatienceToInvest.com is also a trade leader on Collective2.com. We may receive compensation by promoting some collective2 strategies over others. Should you decide to make or avoid any investments or use any service due to the information on this site or related information you assume full responsibility and risks and will not hold howiinvest.com it’s associated sites or its owners responsible. You also acknowledge investing is risky and can result in the loss of all your capital and even more than your original capital in some cases.
Clearly, we are seeing some volatility and drawdowns today and we may have to make some moves today. The obvious question is what happens next. The first thing I remind myself to do though is IGNORE THE NOISE! Good investors don’t make decisions based on what their portfolio did today.
As of writing this at 10:38 AM Eastern my personal accounts are down by over $20,000. That is about 4 times the value of my daily driver car! It is natural to have that stress me out a bit. But let me say it again, “good investors don’t make decisions based on what their portfolio did today.”
For the most part I think technical analysis alone doesn’t provide higher rates of return. This isn’t always true, but on average I believe technical analysis provides lower rates of return when you factor in costs, taxes, and missed opportunities.
Take for example the chart below. In red we can see TQQQ. In blue we can see a simple 200 day moving average model applied to TQQQ. Which one has a higher rate of return? The obvious benefit of the technical analysis system is that it has a better max drawdown. That is a big win. Likewise, a system like that could prevent an even larger drawdown that the buy and hold would likely experience in a period like the dot com bust.
Naturally some want to then trade more frequently. So, let’s look at a strategy where we follow the 50 day sma. In this we can see the drawdown is about the same, but the CAGR is much worse.
This pattern continues if we shorten the SMA to a 10-day sma.
Now there are obviously ways to better utilize the 10-day sma and rotate into other assets etc. However, in general I believe there is this sweet spot. You don’t want to be a buy and hold investor with leverage, but you also don’t want to be a day trader with leverage. The downside of this sweet spot is that you will have days where you have sudden 5% drawdowns and on rare occasions larger than 10%. That just isn’t suitable for most people and that is okay. However, it is okay for me. Fortunately, I have been doing this long enough that I am able to roll with the punches. I didn’t really start trading this way until 2019, but once I did, I started to notice huge improvements. There is no covering up of the fact that 2022 was a rough year. But, in a longer-term context I think it makes sense. Take a look at this chart below of using 50/50 stocks and bonds with 3X leverage simulated going back to the 70s (source). This isn’t a perfect simulation as this free tool only allows flat leverage costs etc. However, it is a helpful demonstration. See how much money was made using leverage vs using the S&P 500. But look at the second chart below and tell me which year was the worst year for the leveraged portfolio. It was 2022. I mentioned this in 2022 and said it doesn’t mean 2023 is going to be bad. 2023 turned out to be great.
I have a host of signals I use in my algorithms. I don’t plan to share them all, but I will show my results. Below you can see a screenshot of my portfolio analyst report. In 2019, I started investing with my current approach and it has done wonders for me. I use this approach in my IRAs, HSAs, and taxable accounts. If you want to follow along you can use the blog or my links to my C2 strategies.
So I know on days like today people get jittery. I do too. We could be at the beginning of a 20% drawdown for my strategies. Or we could be about to experience a 20% launch. It is impossible to know. After the fed meeting today we may get some buy or sell signals. I do not know the future. Either way I will be sticking with my algorithms as I think they are my best chance to make money in the long run based on my extensive backtesting and live experience. I will not be taking trades because just because there has been a drawdown or because someone that hasn’t beat the S&P 500 thinks I should have tighter stops.
This is not investment advice for you. This website is designed to talk about investments but it is not designed to give you personalized investment advice. This site contains generic information that does not have the capability of taking your personal risk tolerance, goals, assets, or other factors into account. Therefore, this site and all of its related content is for entertainment, informational, and educational purposes only.
The owner of PatienceToInvest.com is also a trade leader on Collective2.com. We may receive compensation by promoting some collective2 strategies over others. Should you decide to make or avoid any investments or use any service due to the information on this site or related information you assume full responsibility and risks and will not hold howiinvest.com it’s associated sites or its owners responsible. You also acknowledge investing is risky and can result in the loss of all your capital and even more than your original capital in some cases.
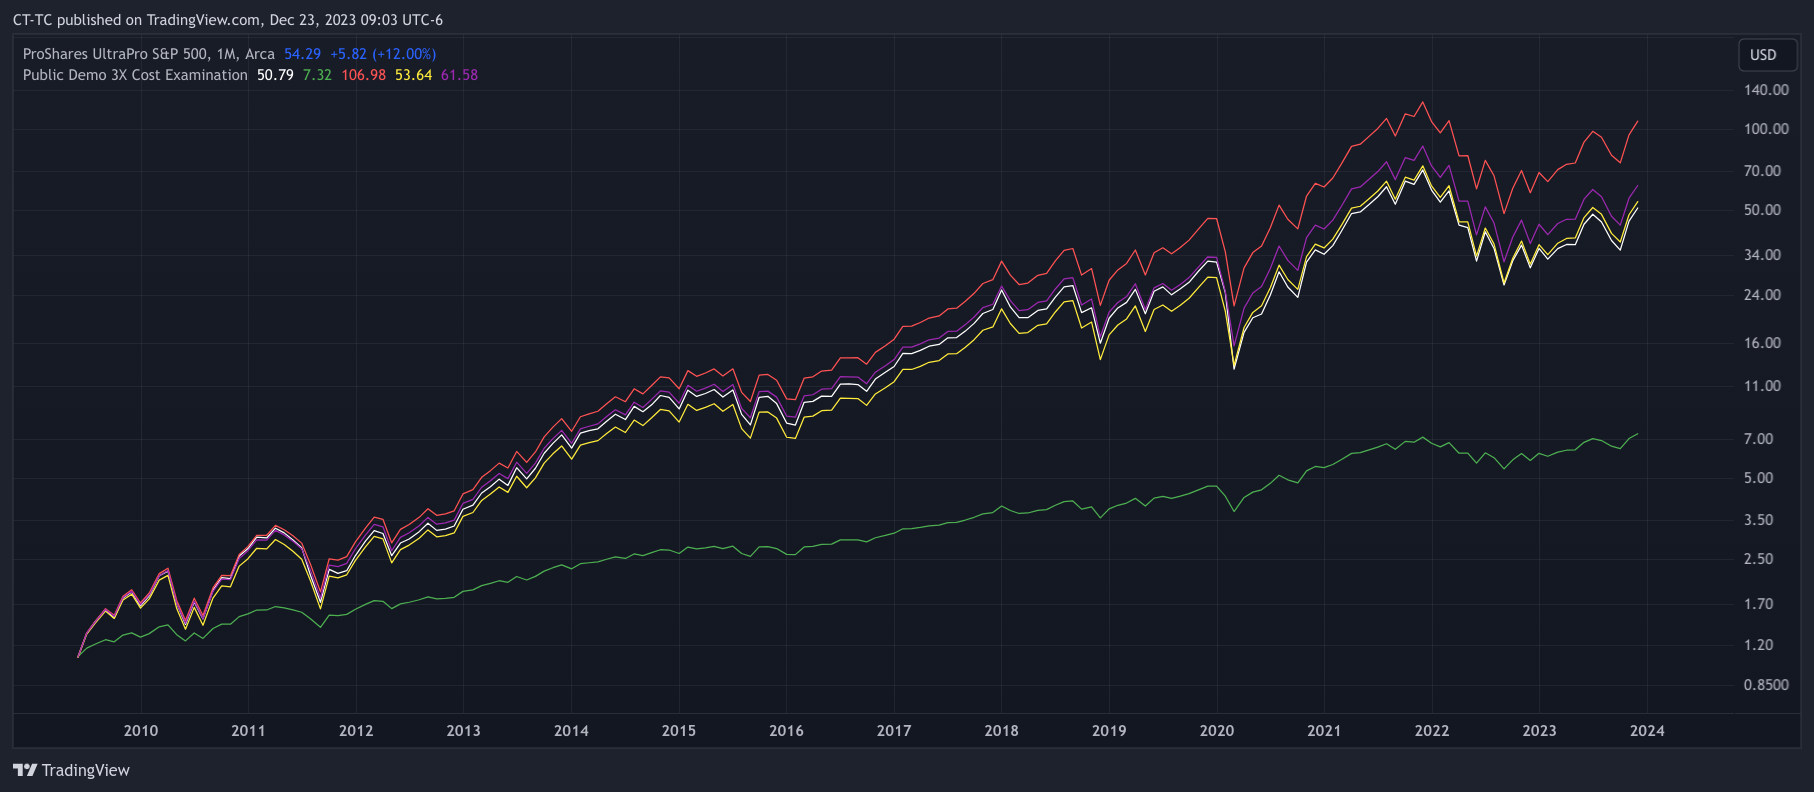
Leverage in markets is nothing new, but the forms and costs have certainly changed over time. In this post I wanted to model the importance of including borrowing costs in your analysis when deciding if leveraged ETFs (LETFs) are right for you.
In the next two charts you will see a log and a linear chart for the following:
White: The total return of UPRO (an actual leveraged ETF).
Green: The total return of the S&P 500 with dividends reinvested.
Red: An estimate of a 3X leveraged ETF of the S&P 500 that only includes an expense ratio cost.
Yellow: A 3X leveraged ETF that includes an expense ratio and estimates the cost of leverage using the 10 year treasury yield.
Purple: A 3X leveraged ETF that includes an expense ratio and estimates the cost of leverage using the Fed Funds rate.
Log Scale 1. White is UPRO total return. 2. Green is SPXTR (S&P with dividends reinvested) 3. Red is 3X the monthly return of SPXTR with a 1% expense ratio 4. Yellow is 3X the monthly SPXTR return with leverage costs of 2 times the US 10 year yield and a 1% expense ratio. 5. Purple is 3X the monthly SPXTR return minus 2X (the Fed Funds Rate + 1%) minus 1% expense ratio. Linear Scale. 1. White is UPRO total return. 2. Green is SPXTR (S&P with dividends reinvested) 3. Red is 3X the monthly return of SPXTR with a 1% expense ratio 4. Yellow is 3X the monthly SPXTR return with leverage costs of 2 times the US 10 year yield and a 1% expense ratio. 5. Purple is 3X the monthly SPXTR return minus 2X (the Fed Funds Rate + 1%) minus 1% expense ratio.
All three synthetic versions of UPRO may seem like reasonable estimates, but I don’t think this is the case. The red curve that does not include the cost of leverage is problematic. It overestimates the benefit of using leverage. In this timeframe when UPRO existed which is less than 15 years it is an okay estimate because the cost of leverage happened to be quite low at that time. However if we extend the backtests now to as far back as we have data on TradingView for the Fed Funds rate we will quickly see the problem.
Log Scale. 1. White or UPRO is no longer graphed as it is not available over this timeframe. 2. Green is SPXTR (S&P with dividends reinvested) 3. Red is 3X the monthly return of SPXTR with a 1% expense ratio 4. Yellow is 3X the monthly SPXTR return with leverage costs of 2 times the US 10 year yield and a 1% expense ratio. 5. Purple is 3X the monthly SPXTR return minus 2X (the Fed Funds Rate + 1%) minus 1% expense ratio. Linear Scale. 1. White or UPRO is no longer graphed as it is not available over this timeframe. 2. Green is SPXTR (S&P with dividends reinvested) 3. Red is 3X the monthly return of SPXTR with a 1% expense ratio 4. Yellow is 3X the monthly SPXTR return with leverage costs of 2 times the US 10 year yield and a 1% expense ratio. 5. Purple is 3X the monthly SPXTR return minus 2X (the Fed Funds Rate + 1%) minus 1% expense ratio.
On the linear scale we can see that not graphing the cost of leverage leads to results that are dramatically unrealistic. If anyone is considering using leveraged ETFs they should be sure they understand the relationship between interest rates and the cost of leverage that they cause to the leveraged ETFs they use.
Going to 1913
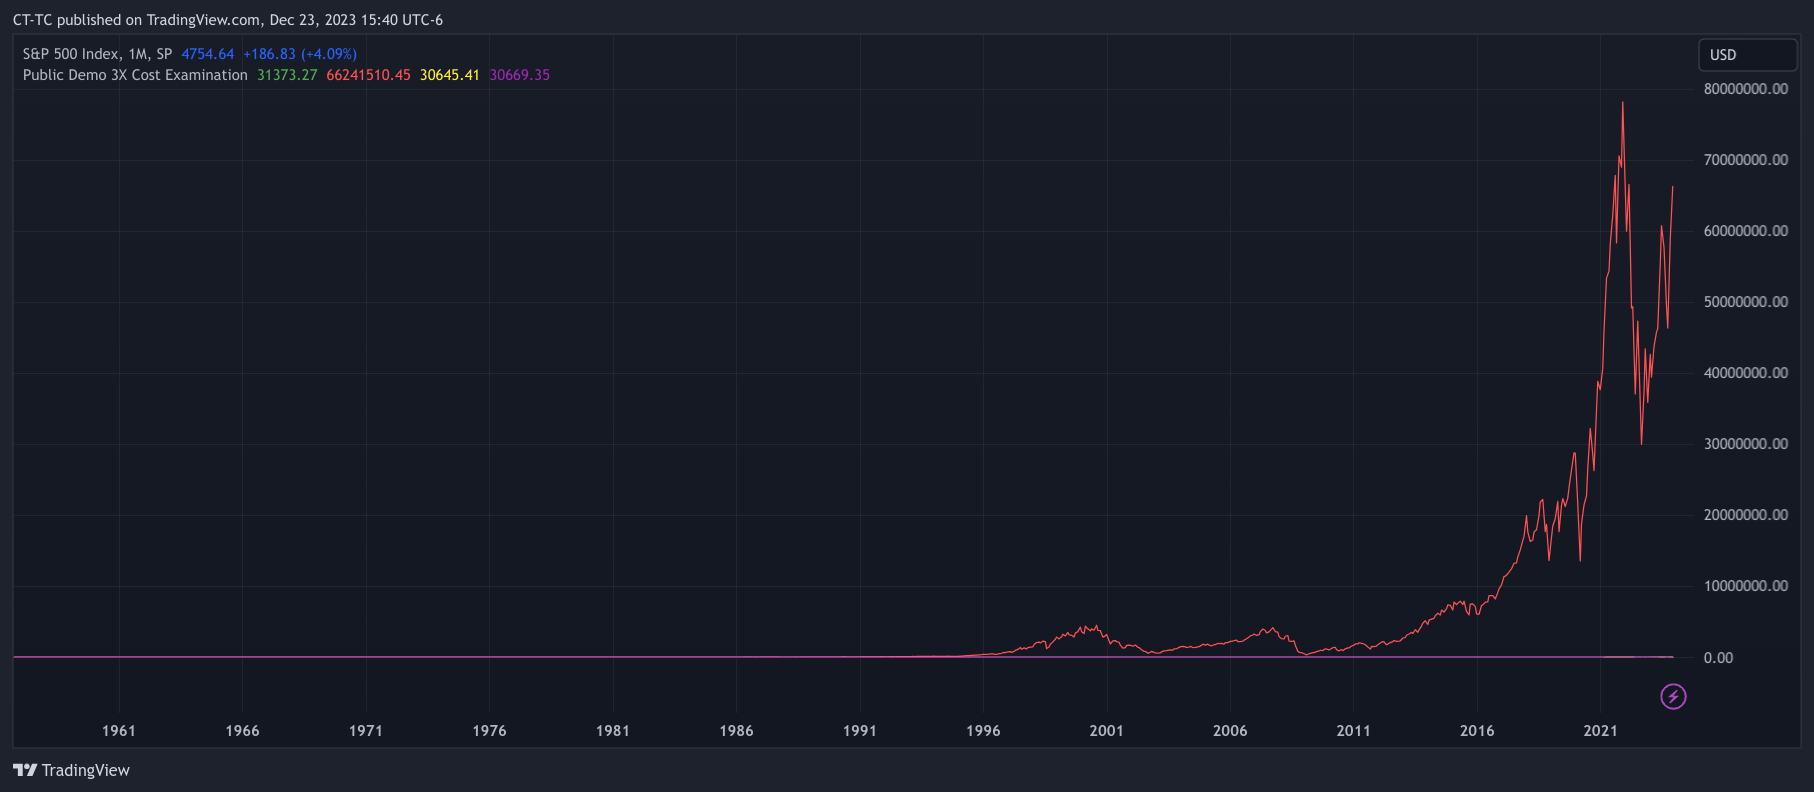
The fed funds rate isn’t available prior to 1955 on tradingview but the 10 year US treasury yield is. Since we can see relativley similar results let’s now go back to 1913 with the synthetic version of a 3X leveraged ETF. I have intentionally used only monthly data up to now in order to allow going back to 1913. From 1913 to the 1950s only monthly data is available for SPX.
Log Scale. 1. White or UPRO is no longer graphed as it is not available over this timeframe. 2. Green is SPXTR (S&P with dividends reinvested) 3. Red is 3X the monthly return of SPXTR with a 1% expense ratio 4. Yellow is 3X the monthly SPXTR return with leverage costs of 2 times the US 10 year yield and a 1% expense ratio. 5. Purple is no longer available as the fedfunds rate data does not go back this far.
View, Track, and Copy My Trades Live
In addition to this blog you can follow a mixture of my live brokerage accounts and various strategies using the Strategies Page on my website. If you have the right brokerage account you can set it up to automatically copy my trading live. For more information check out the strategies page.
Resources
Below I have provided you with a link to the chart. You can zoom in our out and the chart should recalculate to what time frame you want to see. You can also use the excel file to see the data or you can take the code below and build on it.
//@version=5
//US SPX as security
//For each item the start period can only be about a year after that asset starts
//Stocks and Gold 1 Jan 1872
//Houseing
//https://www.tradingview.com/blog/en/pine-script-and-charts-become-better-acquainted-32927/
indicator(title="Demo History, Lev, Active", shorttitle="Public Demo 3X Cost Examination", overlay=true, timeframe="", timeframe_gaps=true)
StartTime = input.time(timestamp("1 May 1913"), title="Start Comparison Calc")
//StartTime = input.time(timestamp(chart.left_visible_bar_time), title="Start Comparison Calc")
//Price Function x days ago
priceXDaysAgo(numDays,PriceItem) =>
targetTimestamp = time - numDays*60*60*24*1000
// Declare a result variable with a "void" value
float result = if false
1
// We'll scan backwards through the preceding bars to find the first bar
// earlier than X days ago (it might be a little greater than X days if
// there was a break in trading: weekend, public holiday, etc.)
for i = 1 to 1000
if time[i] < targetTimestamp
result := PriceItem[i]
break
result
//
// Save the `open` of the leftmost visible bar.
var float chartOpen = na
if time == chart.left_visible_bar_time
chartOpen := open
//var leverageFee = input(Title= "Leverage Annual Cost %" ,2)
var chartStartTime = time
var SPXfilterTime = time
//Asset Data
UnderlyingClose = close
SPX_close = request.security('SPX', timeframe.period,close)
div = request.security('QUANDL:MULTPL/SP500_DIV_YIELD_MONTH',timeframe.period, close)
goldclose = request.security('TVC:GOLD',timeframe.period, close)
HouseClose = request.security('FRED:MSPUS',timeframe.period, close)
US10Yclose = request.security('TVC:US10Y',timeframe.period, close)
FEDFUNDSclose = request.security('FRED:FEDFUNDS',timeframe.period, close)
//Period of dividend yield
time_between_bars = time_close-time_close[1]
days_between_bars = time_between_bars/24/60/60/1000
dailyDivYield = (math.pow(1+MostRecentDiv/100,1/365.25)-1)
PeriodDivYield = math.pow(1+dailyDivYield,days_between_bars)-1
//Need to find how to have SPXTR_PRICE on first bar be SPX bar. Then have it build from there.
MixGrowth := nz(MixGrowth[1],MixGrowth)*(1+BondReturn/3 + GoldReturn/3 + SPXTRReturn/3)
LevMixGrowth := nz(LevMixGrowth[1],LevMixGrowth)*(1+BondReturn + GoldReturn + SPXTRReturn-US10Yclose*2/100/12) // it does have 3x leverage because each is at full
This is not investment advice for you. This website is designed to talk about investments but it is not designed to give you personalized investment advice. This site contains generic information that does not have the capability of taking your personal risk tolerance, goals, assets, or other factors into account. Therefore, this site and all of its related content is for entertainment, informational, and educational purposes only.
The owner of PatienceToInvest.com is also a trade leader on Collective2.com. We may receive compensation by promoting some collective2 strategies over others. Should you decide to make or avoid any investments or use any service due to the information on this site or related information you assume full responsibility and risks and will not hold howiinvest.com it’s associated sites or its owners responsible. You also acknowledge investing is risky and can result in the loss of all your capital and even more than your original capital in some cases.
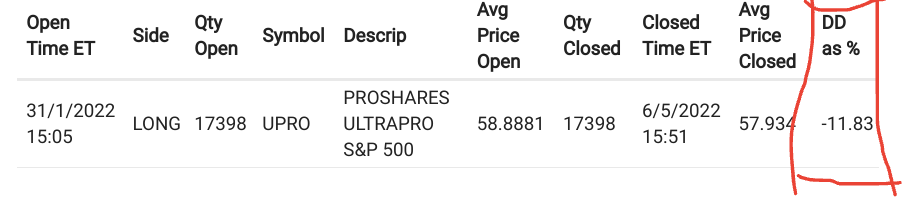
They also posted the screenshot below highlighting a trade where that cost the strategy roughly 12% of capital.
I have had some good conversations with this user before in other threads and have nothing against them. I am unsure exactly how they intend the statement and screenshot, but I take it to mean they are not impressed with my strategy. I appreciate their concern, but likely would disagree with their view of how problematic it is. Let me explain.