My first low-effort attempt to track SVIX using VXX puts is due for a check-in. It would be really nice to be able to use VXX puts instead of SVIX, as it would remove the need for K-1 forms and provide better risk management. The premium cost may be too expensive to achieve a similar growth curve. Let’s take a look.
Continue reading “SVIX via VXX Puts April 2024”Category: SVIX via VXX Puts
1955 & 1913 LETF Backtest
Leverage in markets is nothing new, but the forms and costs have certainly changed over time. In this post I wanted to model the importance of including borrowing costs in your analysis when deciding if leveraged ETFs (LETFs) are right for you.
In the next two charts you will see a log and a linear chart for the following:
- White: The total return of UPRO (an actual leveraged ETF).
- Green: The total return of the S&P 500 with dividends reinvested.
- Red: An estimate of a 3X leveraged ETF of the S&P 500 that only includes an expense ratio cost.
- Yellow: A 3X leveraged ETF that includes an expense ratio and estimates the cost of leverage using the 10 year treasury yield.
- Purple: A 3X leveraged ETF that includes an expense ratio and estimates the cost of leverage using the Fed Funds rate.
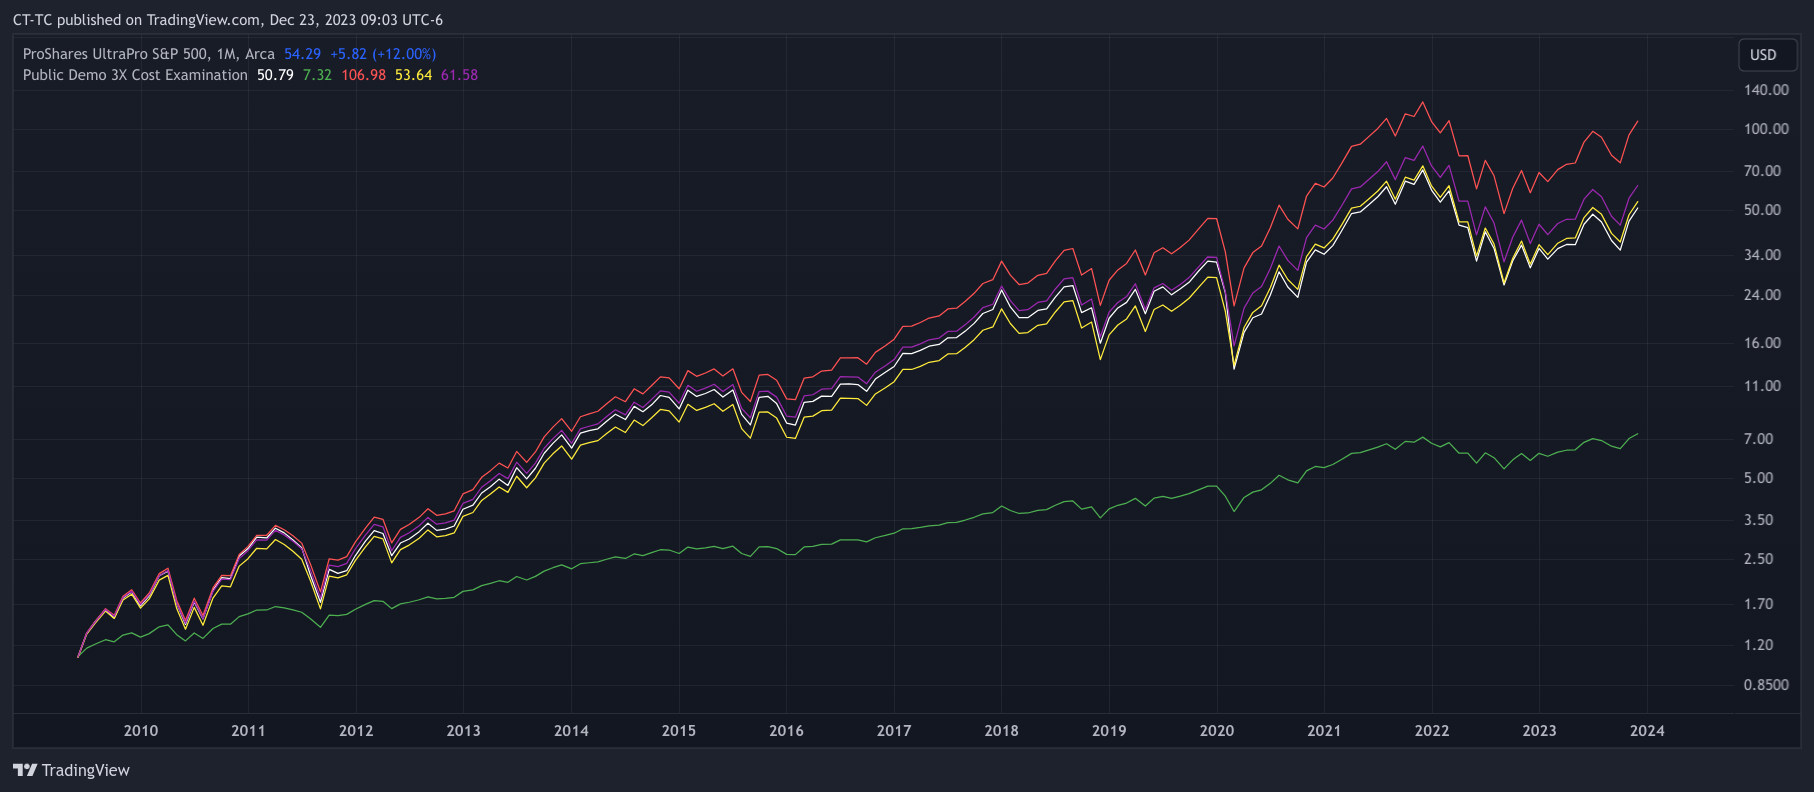

All three synthetic versions of UPRO may seem like reasonable estimates, but I don’t think this is the case. The red curve that does not include the cost of leverage is problematic. It overestimates the benefit of using leverage. In this timeframe when UPRO existed which is less than 15 years it is an okay estimate because the cost of leverage happened to be quite low at that time. However if we extend the backtests now to as far back as we have data on TradingView for the Fed Funds rate we will quickly see the problem.

On the linear scale we can see that not graphing the cost of leverage leads to results that are dramatically unrealistic. If anyone is considering using leveraged ETFs they should be sure they understand the relationship between interest rates and the cost of leverage that they cause to the leveraged ETFs they use.
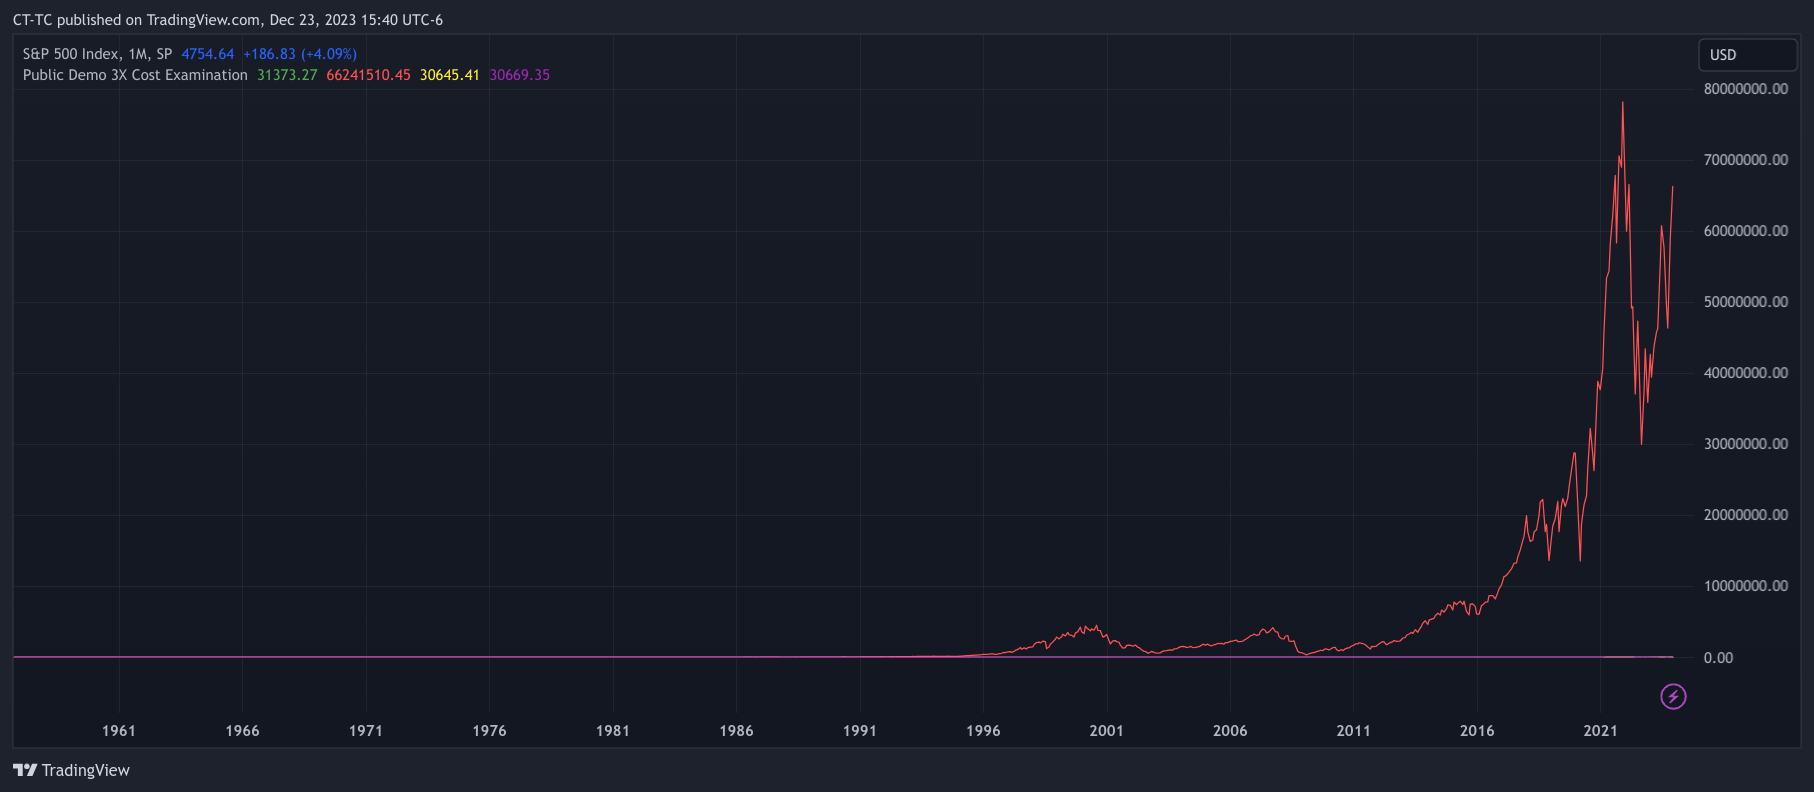
Going to 1913
The fed funds rate isn’t available prior to 1955 on tradingview but the 10 year US treasury yield is. Since we can see relativley similar results let’s now go back to 1913 with the synthetic version of a 3X leveraged ETF. I have intentionally used only monthly data up to now in order to allow going back to 1913. From 1913 to the 1950s only monthly data is available for SPX.

View, Track, and Copy My Trades Live
In addition to this blog you can follow a mixture of my live brokerage accounts and various strategies using the Strategies Page on my website. If you have the right brokerage account you can set it up to automatically copy my trading live. For more information check out the strategies page.
Resources
Below I have provided you with a link to the chart. You can zoom in our out and the chart should recalculate to what time frame you want to see. You can also use the excel file to see the data or you can take the code below and build on it.
https://www.tradingview.com/chart/oJyPPDp7/
//@version=5

//US SPX as security

//For each item the start period can only be about a year after that asset starts

//Stocks and Gold  1 Jan 1872

//Houseing

//https://www.tradingview.com/blog/en/pine-script-and-charts-become-better-acquainted-32927/


indicator(title="Demo History, Lev, Active", shorttitle="Public Demo 3X Cost Examination", overlay=true, timeframe="", timeframe_gaps=true)

StartTime = input.time(timestamp("1 May 1913"), title="Start Comparison Calc")

//StartTime = input.time(timestamp(chart.left_visible_bar_time), title="Start Comparison Calc")

//Price Function x days ago

priceXDaysAgo(numDays,PriceItem) =>

    targetTimestamp = time - numDays*60*60*24*1000


    // Declare a result variable with a "void" value

    float result = if false

        1


    // We'll scan backwards through the preceding bars to find the first bar

    // earlier than X days ago (it might be a little greater than X days if

    // there was a break in trading: weekend, public holiday, etc.)

    for i = 1 to 1000

        if time[i] < targetTimestamp

            result := PriceItem[i]

            break

    result

//

// Save the `open` of the leftmost visible bar.

var float chartOpen = na

if time == chart.left_visible_bar_time

    chartOpen := open


//var leverageFee = input(Title= "Leverage Annual Cost %" ,2)

var chartStartTime = time

var SPXfilterTime = time


//Asset Data

UnderlyingClose = close

SPX_close = request.security('SPX', timeframe.period,close)

div = request.security('QUANDL:MULTPL/SP500_DIV_YIELD_MONTH',timeframe.period,  close)

goldclose = request.security('TVC:GOLD',timeframe.period,  close)

HouseClose = request.security('FRED:MSPUS',timeframe.period,  close)

US10Yclose = request.security('TVC:US10Y',timeframe.period,  close)

FEDFUNDSclose = request.security('FRED:FEDFUNDS',timeframe.period,  close)


//Most Recent available data

float MostRecentDiv = 0

MostRecentDiv:=nz(div,nz(MostRecentDiv[1]))

float MostRecentSPX = 0

MostRecentSPX:=nz(SPX_close,nz(MostRecentSPX[1],4.5))

float MostRecentGold = 0

MostRecentGold:=nz(goldclose,nz(MostRecentGold[1],4.5))

float MostRecentHouse = 0

MostRecentHouse:=nz(HouseClose,nz(MostRecentHouse[1],4.5))

float MostRecent10Y = 0

MostRecent10Y:=nz(US10Yclose,nz(MostRecent10Y[1],4.5))

float MostRecentFEDFUNDS = 0

MostRecentFEDFUNDS:=nz(FEDFUNDSclose,nz(MostRecentFEDFUNDS[1],4.5))

float MostRecentUnderlying = 0

MostRecentUnderlying:=nz(UnderlyingClose,nz(MostRecentUnderlying[1],4.5))


//Period of dividend yield

time_between_bars = time_close-time_close[1]

days_between_bars = time_between_bars/24/60/60/1000

dailyDivYield = (math.pow(1+MostRecentDiv/100,1/365.25)-1)

PeriodDivYield = math.pow(1+dailyDivYield,days_between_bars)-1

//Need to find how to have SPXTR_PRICE on first bar be SPX bar. Then have it build from there.


//Growth Start

float UnderlyingGrowth = chartOpen

float SPXTR_Growth =  chartOpen

float SPX_Growth = chartOpen

float Gold_Growth = chartOpen

float House_Growth = chartOpen

float B10Y_Growth = chartOpen

float MixGrowth = chartOpen

float LevMixGrowth = chartOpen

float ActLevMixGrowth = chartOpen

float levStocksGrowth = chartOpen

float levStocks10YGrowth = chartOpen

float levStocksFEDFundsGrowth = chartOpen

float ActiveMixNoLevGrowth=chartOpen

float levStocksGrowthwithborrow = chartOpen

float Active3XStocksGrowth = chartOpen

//Bond Price Calculation MostRecent10Y

MostRecentYield10Y = MostRecent10Y/100

Pv10Y = math.pow(1+MostRecentYield10Y,10)

YieldPeriod = MostRecentYield10Y/(365/days_between_bars)

float BondReturn = 0

float GoldReturn = 0

float SPXTRReturn = 0

float levstocksRETURN = 0

float levstocks10YRETURN = 0

float levstocksFEDFUNDSRETURN = 0


if time > StartTime

    UnderlyingGrowth := (MostRecentUnderlying/nz(MostRecentUnderlying[1],MostRecentUnderlying))*nz(UnderlyingGrowth[1],UnderlyingGrowth)

    SPX_Growth := (MostRecentSPX/nz(MostRecentSPX[1],MostRecentSPX))*nz(SPX_Growth[1],SPX_Growth)

    SPXTR_Growth := (MostRecentSPX/nz(MostRecentSPX[1],MostRecentSPX)+nz(PeriodDivYield))*nz(SPXTR_Growth[1],SPXTR_Growth)

    Gold_Growth := (MostRecentGold/nz(MostRecentGold[1],MostRecentGold))*nz(Gold_Growth[1],Gold_Growth)

    House_Growth := (MostRecentHouse/nz(MostRecentHouse[1],MostRecentHouse))*nz(House_Growth[1],House_Growth)

    B10Y_Growth := ((nz(Pv10Y[1],Pv10Y)-Pv10Y)/nz(Pv10Y[1],Pv10Y)+1+YieldPeriod)*nz(B10Y_Growth[1],B10Y_Growth)

    BondReturn := B10Y_Growth/nz(B10Y_Growth[1],B10Y_Growth)-1

    GoldReturn := Gold_Growth/nz(Gold_Growth[1],Gold_Growth)-1

    SPXTRReturn := SPXTR_Growth/nz(SPXTR_Growth[1],SPXTR_Growth)-1


    MixGrowth := nz(MixGrowth[1],MixGrowth)*(1+BondReturn/3 + GoldReturn/3 + SPXTRReturn/3)

    LevMixGrowth  := nz(LevMixGrowth[1],LevMixGrowth)*(1+BondReturn + GoldReturn + SPXTRReturn-US10Yclose*2/100/12) // it does have 3x leverage because each is at full


/////////

    levstocksRETURN := levStocksGrowth/nz(levStocksGrowth[1],levStocksGrowth)-1

    levStocksGrowth  := nz(levStocksGrowth[1],levStocksGrowth)*(1 + SPXTRReturn*3.0-1.0/100/12)

    levStocks10YGrowth := nz(levStocks10YGrowth[1],levStocks10YGrowth)*(1 + SPXTRReturn*3.0-US10Yclose*2.0/100/12-1.0/100.0/12.0)

    levStocksFEDFundsGrowth := nz(levStocksFEDFundsGrowth[1],levStocksFEDFundsGrowth)*(1 + SPXTRReturn*3.0-(FEDFUNDSclose+1.00)*2.00/100.0/12.0-1.0/100.0/12.0)


plot(UnderlyingGrowth, title="Selected Asset", color=color.white)

plot(SPXTR_Growth, title="S&P with DRIP", color=color.green)

plot(levStocksGrowth, title="3X Stocks - Exp Ratio", color=color.red)

plot(levStocks10YGrowth, title="3X Stocks - EXp Ratio and 10Y x 2", color=color.yellow)

plot(levStocksFEDFundsGrowth, title="3X Stocks - (Exp Ratio & 2x(Fedfunds + 1%))", color=color.purple)Disclaimer
This is not investment advice for you. This website is designed to talk about investments but it is not designed to give you personalized investment advice. This site contains generic information that does not have the capability of taking your personal risk tolerance, goals, assets, or other factors into account. Therefore, this site and all of its related content is for entertainment, informational, and educational purposes only.
The owner of PatienceToInvest.com is also a trade leader on Collective2.com. We may receive compensation by promoting some collective2 strategies over others. Should you decide to make or avoid any investments or use any service due to the information on this site or related information you assume full responsibility and risks and will not hold howiinvest.com it’s associated sites or its owners responsible. You also acknowledge investing is risky and can result in the loss of all your capital and even more than your original capital in some cases.
Merry Christmas
We had a nice finish to the week leading into Christmas. I hope everyone has a great weekend and holiday as markets are closed on Monday.
Disclaimer
This is not investment advice for you. This website is designed to talk about investments but it is not designed to give you personalized investment advice. This site contains generic information that does not have the capability of taking your personal risk tolerance, goals, assets, or other factors into account. Therefore, this site and all of its related content is for entertainment, informational, and educational purposes only.
The owner of PatienceToInvest.com is also a trade leader on Collective2.com. We may receive compensation by promoting some collective2 strategies over others. Should you decide to make or avoid any investments or use any service due to the information on this site or related information you assume full responsibility and risks and will not hold howiinvest.com it’s associated sites or its owners responsible. You also acknowledge investing is risky and can result in the loss of all your capital and even more than your original capital in some cases.
Backtesting Blind Buying UPRO to 1913
I want to take another look at mimicking UPRO going back to 1913. Of course, UPRO didn’t arrive until around 2010, but with a little math and coding we can simulate what a similar set of holdings may have been like since 1913.
In blue you can see actual UPRO. In green you can see an estimate of SPXTR (the total S&P 500 return with dividends reinvested). In red we can see a synthetic UPRO calculated using 3 times the monthly return of SPXTR. An obvious problem with that is that it doesn’t account for leverage costs of expense ratios. To make a simple estimate as shown in yellow I have taken the SPXTR monthly return, multiplied it by 3, subtracted a 1% annualized expense ratio, and subtracted 2 times the ten year treasury yield.
Now I know this isn’t a perfect calculation for a synthetic UPRO since institutions borrow at shorter term rates and the fund uses a daily multiplier not a monthly one. This is just a way among many of estimating and I have chosen inputs that will let us go back to 1913. The 2 year yield doesn’t go back that far in my data set.

Now that we we can see the rough estimate is atleast in the ballpark let’s look at the full length view going back to 1913 – which is the first year for US10Y data on tradingview.
Continue reading “Backtesting Blind Buying UPRO to 1913”Orphaned Stops on Collective2
I wanted to verify how collective2 handles stop orders for positions that may have already exited or stops for quantities that are greater than the current position. To test this I opened 2 shares of VXX and placed several sets of stops for 2 shares. Then I closed one share and waited to see what would happen.
Continue reading “Orphaned Stops on Collective2”Looking Back at a Top Strategy (Kamtrader)
About 16 months ago, I reviewed the strategy Kamtrader which was pretty popular at the time. How did my predictions turn out? Back in July I wrote this blog post and posted this youtube video on Kamtrader. I was looking a the rather small number of YouTube videos I have made. Seeing the title I thought what has happened to Kamtrader, which I warned was very risky. I always want to see people do well, but I also don’t want to be crazy, wrong, or miss out on good opportunities. So how did I do. Well I just realized today that I already followed up on Kamtrader but forget. Whoops. I guess I’ll do it again. Maybe I will remember that I already followed up on it. See the chart below for more details on how it did.
Continue reading “Looking Back at a Top Strategy (Kamtrader)”Vol Options Strategy
After getting back home refreshed from a fun trip to the UK, I got some great work done on automating the order entry system for my strategy that attempts to short volatility using long positions in options only.
Continue reading “Vol Options Strategy”SVIX via VXX Puts October 2023
Today I did a reallocation for the strategy into a new set of put options to mimic SVIX and took a look at the results of the strategy so far.
Continue reading “SVIX via VXX Puts October 2023”SVIX via VXX Put Options
So far the tracking of SVIX via VXX put options hasn’t been perfect. I am still dialing in how I want to go about modeling a synthetic SVIX. Today though with an over 11% drop in SVIX the results were interesting…
Continue reading “SVIX via VXX Put Options”