Screenshots, one day performance, one year performance – none of it matters! When I see posts like that I think of a casino advertisement showing jackpot winners. We know people win in a casino, but we also know that the odds of me walking into a casino and walking out with more money are not great.
With investing results it isn’t quite the same because unlike a casino the stock market is rigged in your favor. Monkeys can throw darts at a wall to pick stocks and make money overtime. It isn’t hard. The real question is are you getting results above and beyond pure luck or beyond other investment alternatives such as an index fund etc.

Yesterday my account really was up $27,000 as shown in the screenshot, but it was also down by $12,000 just the other day like I mentioned. Furthermore, you don’t know what my overall net worth is. Plus for all you know I’m just good at photoshop or it done on Fiverr. Yeah I am trying to get you attention with this screenshot, but I’m also telling you it is meaningless.
That is why I use a third party to verify my trading in several different accounts. You don’t have to just join some discord community and sift through all kinds of junk with people posting good testimonials and wonder if that was 1/100 people or really representative of the crowd. All you have to do is go to my strategies page and click the links to the third party verifier to see the results and follow the ongoing strategies. If you don’t have the time follow the trading you can even set up your brokerage account to copy me.
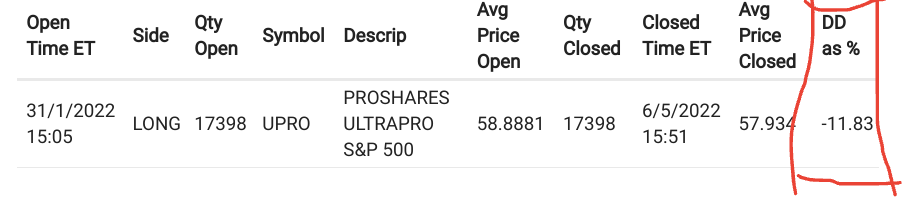
For the most part my strategies did not do much in terms of trading. I did rebalance some out of UPRO and into TQQQ. Other than that things have mostly stayed the same since yesterday.
Disclaimer
This is not investment advice for you. This website is designed to talk about investments but it is not designed to give you personalized investment advice. This site contains generic information that does not have the capability of taking your personal risk tolerance, goals, assets, or other factors into account. Therefore, this site and all of its related content is for entertainment, informational, and educational purposes only.
The owner of PatienceToInvest.com is also a trade leader on Collective2.com. We may receive compensation by promoting some collective2 strategies over others. Should you decide to make or avoid any investments or use any service due to the information on this site or related information you assume full responsibility and risks and will not hold howiinvest.com it’s associated sites or its owners responsible. You also acknowledge investing is risky and can result in the loss of all your capital and even more than your original capital in some cases.