There is some big market news coming out this week and at this moment the VIX and S&P 500 are both up today. What has happened historically when these two move together like this?
Category: Uncategorized
Asteroid Mining Gold
This is an opinion article about gold mining on asteroids. I largely agree with the concepts of the article. It will likely be a long time before asteroid mining is economical or feasible. But it does seem wise to consider the concepts laid out in this article. I am a gold investor myself at the moment. BUT, gold does NOT have an immutable position as the best investment or currency for all-time and it is not a productive asset such as a business.
You Could Have Done Better
When investing you must learn from your mistakes and while not beating yourself up just because you couldn’t accurately predict the future. With that in mind, I want to talk about someone I know that recently turned $60,000 into $120,000 by investing in an illiquid real-estate venture. Obviously, I am very happy for this person, but I think this person could have done better simply investing in a brokerage account or IRA with much less hassle.
In 2007 this person entered into an agreement with several other local investors to invest in single-family rentals in their city. They deposited $60,000 into the venture then in 2022 they received $120,000 and exited the venture. If we annualize that return it is about 4.8%.
For context below are some returns of several portfolios and their performance from 2007 to 2022 YTD.
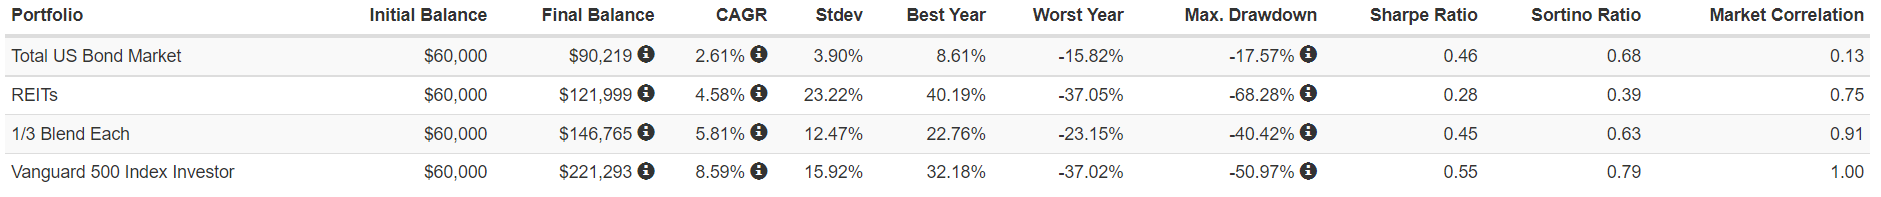

I am a big proponent of patience when investing. Had the real-estate venture been liquid in 2008 I think this particular person would have sold it at an inopportune time. This is exactly what they did with much of their mutual fund portfolio. This is often what hurts investors the most – impatience.
The reality is that if you are investing for the long-term you will need patience no matter the investment. Some investments like stocks and bonds are easy to jump in and out. Others like this real-estate venture are much more illiquid. When you invest with liquid items you need to avoid making rash decisions in periods of crisis. If you can remain patient and consistent you can often get great rates of returns with easy investments like mutual funds and ETFs, without the hassle of purchasing real-estate directly. However, some people do better with real estate largely because they are more likely to ride out the tough times. As this data below shows, the average investor does much worse than most good long-term investment assets primarily because they jump in and out at inopportune times.

In the long-run I think you can get very similar rates of return investing in basic investment accounts without the hassle of direct real estate investing. Direct real estate investments, even when using mortgages, tend to average around 9.5% to 11.7%. In my opinion it would be much easier to invest in a good mix of Real Estate Investment Trusts (REITs), Stocks, and bonds in a well diversified investment account. In an investment account you don’t have to worry about tenant horror stories like this. Would you rather mess with tenants or just have to ignore the tempting “SELL EVERYTHING NOW” button that is far too accessible in your investment account?
I know my answer.
Will 2023 Be Bad for Investments?
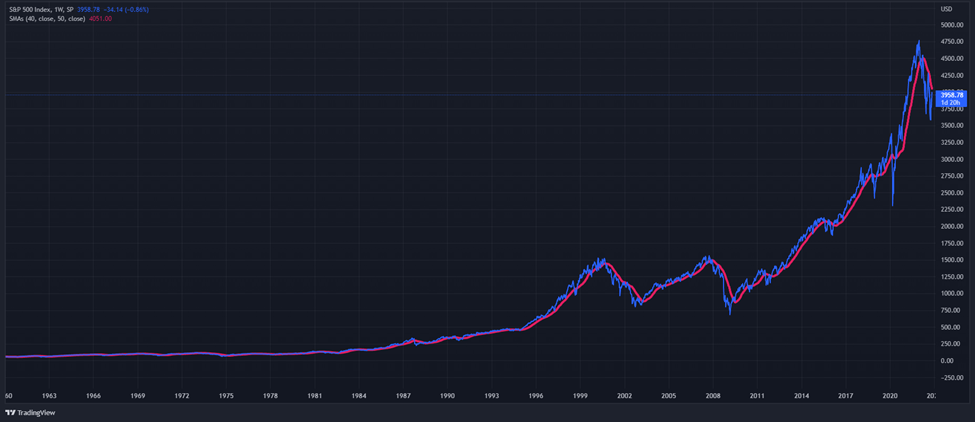
As an extremely simplified example, I have included a chart (log and linear scale) showing the price of the S&P500 in blue and the 40 week average in pink.
As you can see the blue line is currently below the pink line. This is a rudimentary way to define a downtrend. You can see this current crash, covid, 2008, dot com, 87, the crashes of the 70s, and many others. In most of them, the price drops below the line before falling to much lower levels. For this reason and many others, I believe the odds are higher than normal for 2023 to be a bad year – for stocks. However, the average weekly return is positive whether the blue line is above OR below the pink line. The average weekly return is 0.18% when it is above and 0.09% when it is below. Those equate to about 9.8% and 4.8% annualized. So, statistically speaking it could be worth moving out of stocks and into other assets if the estimated return was above 4.8% annualized. This is the type of logic going on within the strategies I run that are active. While one asset is trending down you may have another that is trending up offering an alternative. For example, when stocks are trending down long-term US treasuries often trend up. This year is one of the rare years that stock, bond, crypto, gold, and many other markets are simultaneously in downtrends – by most metrics. There are of course exceptions, but most assets that make sense to consider over long periods of time have not done well this year. Therefore, the algorithms have had a very tough time.
Some signals are starting to occasionally flash buy signals, but most are quickly reversing back causing losses. This whipsaw is a major downside of active trading, but in my opinion, it is a worthwhile risk. It is completely possible that various markets could continue to move in tandem for a long time or start to move asynchronously relatively quickly. No one really knows. My algorithms are designed to monitor many different assets and attempt to rotate into a reasonable mix of whatever has historically done well when a series of different metrics are met. Of course, past returns are not indicative of future returns. Anything could happen and it is entirely possible that the returns could be worse than passive investing or holding cash.
Despite the many risks, I believe the best thing to do is simply stick to the systems as designed and allow the algorithms to make the decisions on when to buy in or out. In the long-run I think this is an excellent way to invest but it does require plenty of patience and still has plenty of risks of loss. My hope is that this year is one of the worst we have to experience for a long time. Of course, only time will tell.


Bitcoin Down Over 70%!
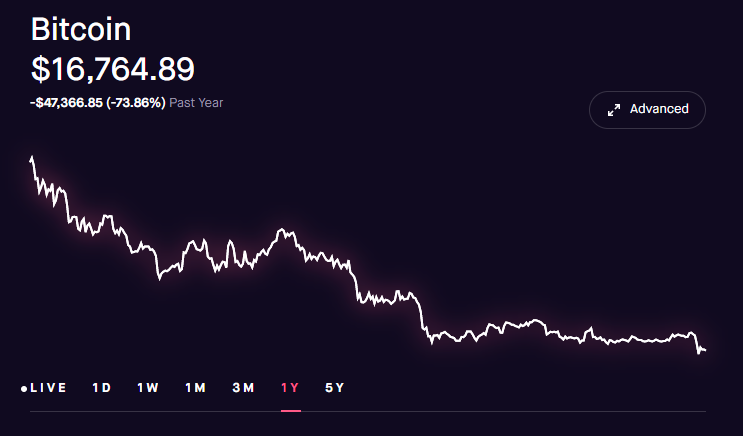
Bitcoin/crypto is down over 70%? Historically has this been a good buying opportunity? I checked Bitcoin using the Robinhood app and saw a scary looking chart. This made me want to see what Bitcoin has done historically after a 70% drop or more.
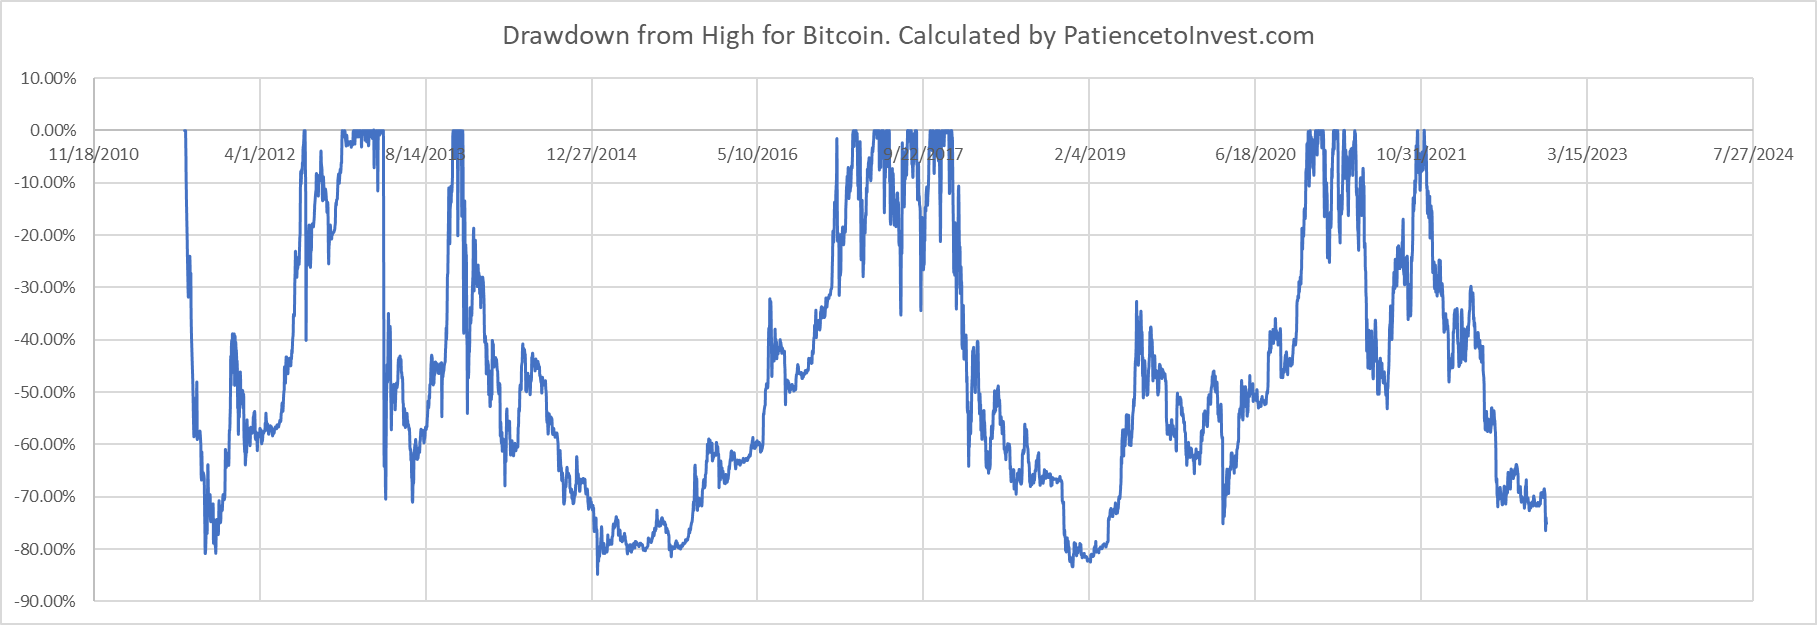

It is interesting to note that the worst drawdown over this period was 84.86%. Currently Bitcoin is down 75.12%. This means for Bitcoin to match or exceed its worst drawdown previously it would still need to drop 39.1% or more from its current price. I think this is important to note. Should it drop more this still wouldn’t be unusual. It would be wise to be mentally prepared for something of that nature.
Excel Workbook
Backtesting C2 Strategies (No Coding)
This is a simple way to backtest some Collective2 strategy selection methods. In this example I am going to show how to backtest investing in strategies by selecting strategies based on AUM.
If you want to see C2 Strategies listed by AUM you just need to go to this link https://collective2.com/datastudies/strategyAUM. If you want to see some snapshots of this leaderboard or other leaderboards through history you just need to go to https://web.archive.org/ and see what snapshots this service has for the AUM link.
The oldest snapshot available is from August 25, 2020. Fortunately this snapshot has links to the various strategies. The snapshots at each link are not always available, but we can get the strategy ID number from the URL it pulls up.
After getting that url we can go to each strategy and check the results using these url formats.
- Delisted or Private Strategies: If a strategy has gone private we can replace the zeros with the ID number in this URL (https://collective2.com/performance/000000) to get a chart of the strategy and do our best to read the prices over the periods in questions.
- Public Strategies: If a strategy is public we can replace the zeros with the ID number in this URL (https://collective2.com/details/000000) then easily zoom in on the data points we need.
REsults
| August 25th, 2020 to October 19th, 2022 | |
| AUM Weighted Return | -9.67% |
| Average Strategy Return | -6.74% |
| Max | 119.72% |
| Min | -118.18% |
| S&P Div Reinvested | 8.41% |
| BND Div Reinvested | -16.86% |
This is a link to a google sheet I used to compile the information. Obviously this same method could be used on some other leader boards such as popularity, TOS, etc.
What Do These Three Strategies Have in Common?
These three strategies posted on the collective2 forums had very sudden drops in value. In this clip I go over some of the warning signs to watch for if you want to avoid something like this.
Can You Trust Jim Rickards
Jim Rickards has been around for a long time, but I would NOT give much weight to his advice. Like someone guessing on the outcome of a coin flip he often is right and wrong! However, he often cherry picks data to make it appear like he is clairvoyant and knows ahead of time that a coin flip will be heads or tails. In short, I would ignore Jim Rickards and not waste money on any of his courses or tools.
Links
Kamtrader Review
This morning I woke up to an email from collective2 talking about their strategy of the week. Though I respect Collective2.com’s decision to promote any strategy they want, I see some risks with this particular strategy that concern me. As of right now the total returns for this strategy have been fantastic, but I have some reasons that make me doubt it will be a good long term strategy. Of course, I could be wrong and I hope the leader does very well. However, I think if they stick to this style it could prove problematic.
Update On 7/21/2022
In less than two weeks following my words of caution, this strategy saw a 62% drawdown. Collective2 is a fantastic website, but you should never subscribe to a strategy simply because it is the strategy of the week.

Money Every Week
Recently a collective2 user that goes both by the name HappyTrading and ForexStar2 went on the forums and made some statements that concern me. I want HappyTrading/ForexStar2 to do well. I honestly hope they are right that they are right and do fantastic. However, I think this strategy is likely to fail if it does not change its methodology soon.

1. Overly Confident
Investors need to think and speak in probabilities. If they don’t, then they are likely overlooking real risks. For example, they posted that no single trade would lose more than 3% due to a 3% stop loss on each trade. Of course, just days later a single trade had a drawdown of 12% in a matter of 5 minutes! I don’t know if this was due to difficulty getting filled, a technical error, or any number of reasons. The point is that being overly confident often means risks are being overlook, typically due to ignorance and occasionally due to negligence.
2. Too Much Leverage!
The strategy has an average leverage use of 38! That is huge! The vast majority of strategies that survive 3 years or longer use less than 5. Leverage can be very helpful in amplifying returns, but too much of a good thing can be deadly. Of the strategies that are 3 years or older and have a positive return on the Old-Timers board, the average leverage use is 3.1 and the maximum daily leverage is 19! In other words, this particular strategy likely has far too much leverage to last for a long time.
3. Too Active!
This strategy is a day trading strategy. Why is that a problem? Day trading is extremely difficult to do successfully and even harder to do on C2 successfully with AutoTraders following. This strategy has had a 202 trades in a period of just 12 days. That is an average of about 16 trades per day. For reference, of the strategies that are three years or older on C2 and appear on the Old-Timers leader board the average trades per day is 0.5!
Of the strategies that are 3 years or older and have a positive return on the Old-Timers board, the average trades per day is just 0.5 and the maximum is just 3.5! Again this doesn’t mean this strategy is doomed, but it definitely is exhibiting some worrying behaviors.
Summary
Strategies that are run by managers with this much confidence, leverage, and activity often end up losing big! So be cautious. They could be right, but there is a graveyard of similar strategies that have come and gone. As of today the strategy looks like the below screenshot. I predict that it will do much worse or be discontinued before long if the manager does not change methodologies. To be clear though, it may see astounding success first. So far it hasn’t. I encourage subscribers to follow strategies that don’t exhibit these types of red flags.
I wish this person all the best, but we certainly disagree on investment methods.

