Not that Wall Street Bets is known for its accuracy but come one. This recent post get’s things totally wrong. No gold has not done nearly as well as stocks since 1972. It literally took me 2 minutes to fact check it. All I did was go to portfoliovisualizer.com then used the asset allocation which lets you go back to 1972. I plugged in one portfolio of US stocks and one portfolio of 100% gold. This link goes directly to the calculation page.

If you own rental houses you want the price of the property to go up, but you also care about collecting rent. With businesses you may collect profits at times without selling the business or you may reinvest the profits. Historically companies paid out more of their profits. More recently they tend to reinvest the profit. That is why today you may see only about 1.5% dividend on stocks, but in the 1980s you may have seen 5% as shown below.

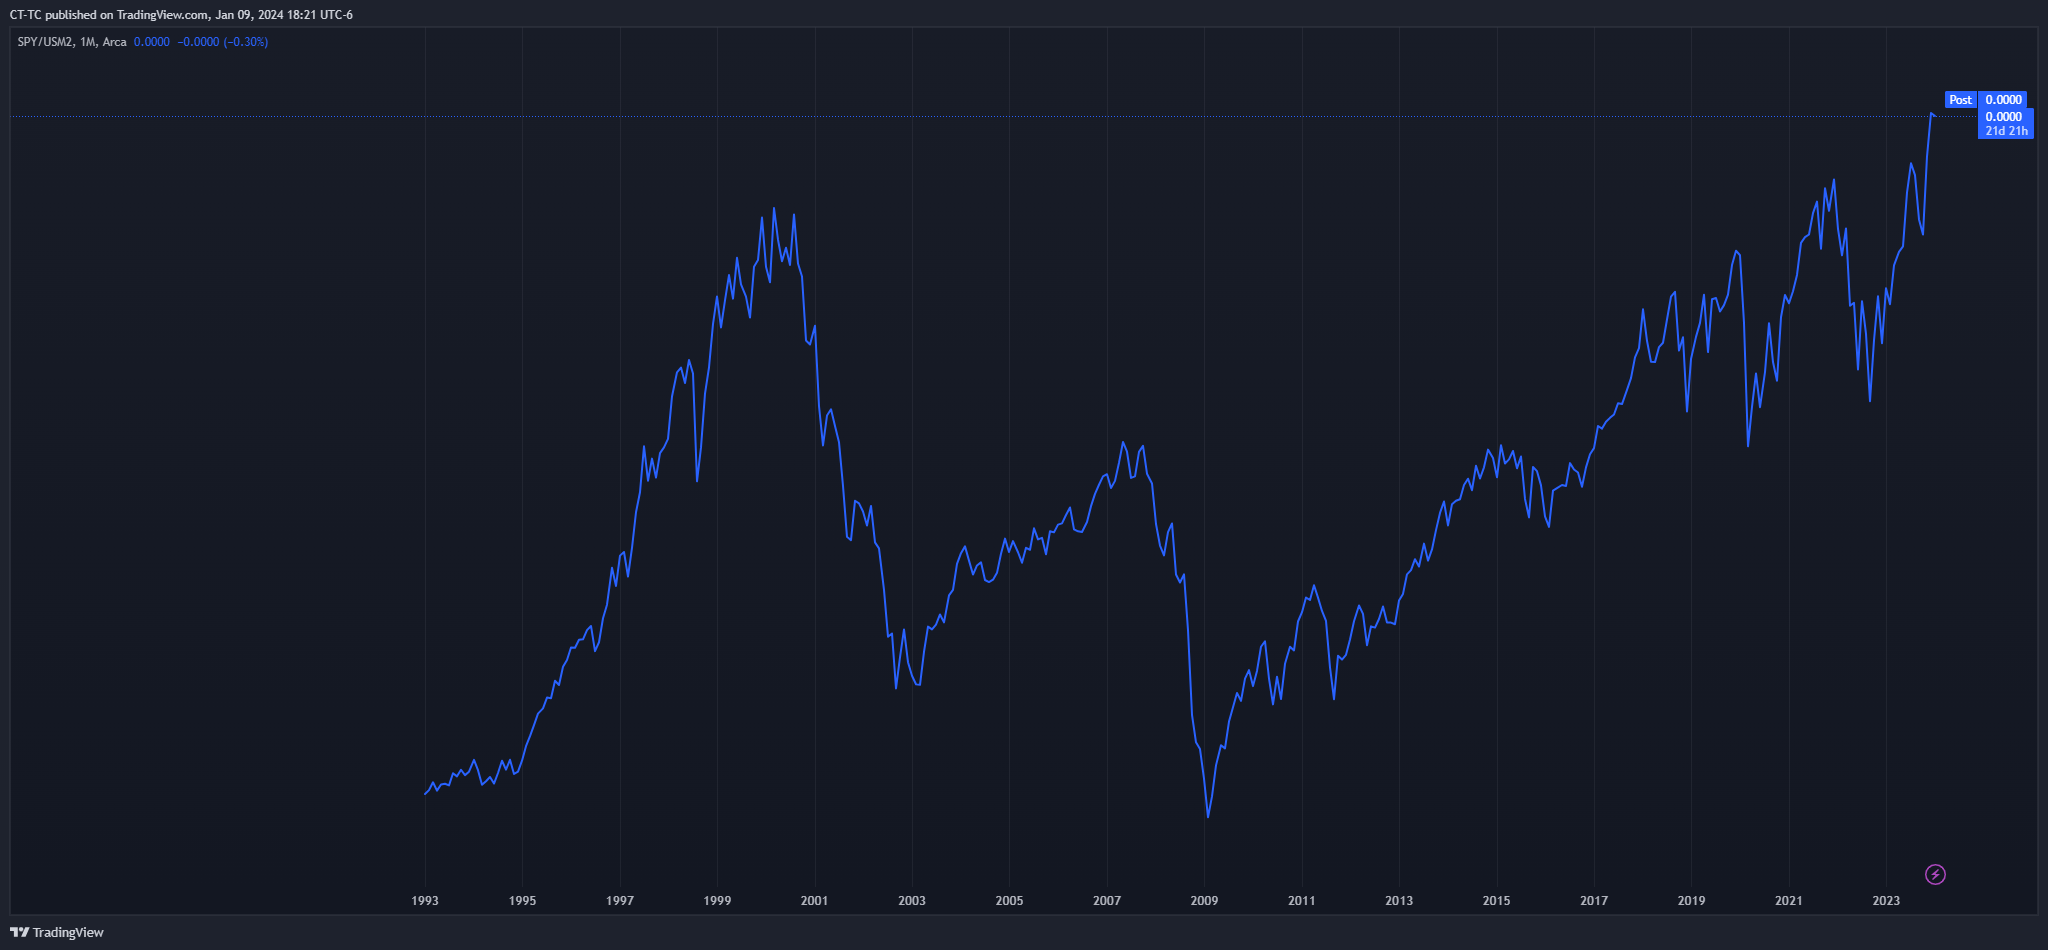
The M2 money claim is also misleading. If you were to graph SPY/USM2 with and without dividends it the chart with dividends would be much better than SPX. Notice I am using SPY instead of SPX because you can’t directly factor in dividends with SPX on tradingview. The date range for SPX and SPY are not the same so you will have to just look at the first chart and match it with the time frame available for SPY.
To be clear going back in history the story is roughly the same if not even better for stocks. It is just a matter of how far back your data set goes.
If you want to see longer term comparisons check out my charts in this post.
The Original Chart
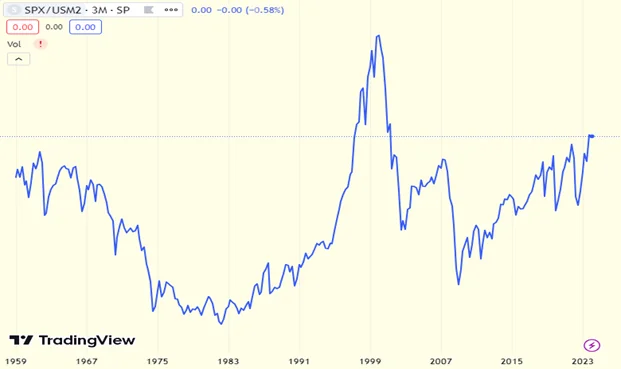
SPY/USM2 without Dividends

SPY/USM2 with dividends
Disclaimer
This is not investment advice for you. This website is designed to talk about investments but it is not designed to give you personalized investment advice. This site contains generic information that does not have the capability of taking your personal risk tolerance, goals, assets, or other factors into account. Therefore, this site and all of its related content is for entertainment, informational, and educational purposes only.
The owner of PatienceToInvest.com is also a trade leader on Collective2.com. We may receive compensation by promoting some collective2 strategies over others. Should you decide to make or avoid any investments or use any service due to the information on this site or related information you assume full responsibility and risks and will not hold howiinvest.com it’s associated sites or its owners responsible. You also acknowledge investing is risky and can result in the loss of all your capital and even more than your original capital in some cases.
